ICE U.S. Dollar Inflation Expectations Index Family
After years of remaining low and stable, inflation has become a key consideration for market participants and policy makers. During 2022, annual inflation in the United States, as measured by the Consumer Price Index, peaked at over 9% and the future path of inflation remains highly uncertain. The key questions on stakeholders’ minds now are:
- If/when inflation will moderate in the near term; and
- Have longer term inflation expectations moved structurally higher post the pandemic?
The answers to these questions will materially impact how monetary policy unfolds in the coming quarters and will certainly impact asset prices in the financial markets.
To help gauge future inflation expectations and inform policy and risk management decision making, ICE Benchmark Administration (IBA) has launched the ICE U.S. dollar Inflation Expectations Index Family.
This family of indexes will provide daily market implied inflation expectations for five tenor periods:
Current Calendar Year
Expected inflation over the current calendar year
(i.e., the market implied expectation for realised inflation over 12 months starting from the previous December’s Consumer Price Index (CPI))
Next Calendar Year
Expected inflation over the subsequent calendar year
(i.e., the market implied expectation for realised inflation over 12 months starting from December this year)
INFL 1Y
Expected inflation over the next 12 calendar months
(i.e., the market implied expectation for realised inflation over the course of the next year, starting from the latest published CPI)
FWD INFL 1x5Y
Expected longer term inflation in one year’s time
(i.e., the market implied five-year inflation expectation one year forward from the latest published CPI)
FWD INFL 5x5Y
Expected longer term inflation in five years’ time.
(i.e., the market implied five-year market inflation expectation five years forward from the latest published CPI)
Methodology
IBA calculates the implied market inflation expectations by sourcing price/yield data from the U.S. Treasury Inflation Protected Securities (TIPS), Treasury Bills, Notes and Bonds, and the inflation linked swaps markets. By combining both Treasury market data (TIPS real yields1 relative to like maturity nominal Bill, Notes and Bonds yields) with inflation swaps pricing data, IBA sources input from the two deepest and most liquid inflation-linked markets to build the index settings. From these data sources, IBA creates a projection of the future path of the Consumer Price Index2 from which forward implied inflation expectations can be calculated; for example, the forward five-year inflation expectation in one years’ time can be derived by referencing the projected CPI levels at one and six-years after the latest published CPI.
See the methodology document here.
Inflation Expectations
Current indicative values for the ICE U.S. Dollar Inflation Expectations Indexes can be found in the table below, set alongside historical indicative data points from 1 July and 4 January of 2021. The indicative values are being provided for information and feedback purposes only, might not be accurate or reliable and may not be used for any other purpose, including as a benchmark in financial contracts, instruments, or to measure the performance of investment funds. Feedback should be sent to [email protected].
The data are subject to the following Disclaimer and Terms of Use.
None of IBA, Intercontinental Exchange, Inc. (ICE), or any third party that provides input data to IBA to calculate or determine the data herein, or any of its or their affiliates, accepts any responsibility or liability arising out of on in connection with the data herein or any use that you may make of it and all implied terms, conditions and warranties and liabilities in relation to the data are hereby excluded to the fullest extent permitted by law. "ICE" and "ICE Benchmark Administration" are trademarks of ICE and/or its affiliates.
| Index Setting | April 18, 2024 | July 1, 2021 | January 4, 2021 |
| Calendar Year 2024 | 3.22% | 2.42% | 2.05% |
|---|---|---|---|
| Calendar Year 2025 | 2.44% | 0.00% | 0.00% |
| INFL 1Y | 2.12% | 2.87% | 1.98% |
| FWD INFL 1x5Y | 2.46% | 2.40% | 2.08% |
| FWD INFL 5x5Y | 2.41% | 2.18% | 2.10% |
| Real rate (1Y)* | 3.10% | ||
| Fwd 1x5 (Real rates*) | 1.73% | ||
| Fwd 5x5 (Real rates*) | 1.67% |
* Calculations of real rates based on ICE Swap Rate USD SOFR (first published 1 Oct 2021). Real rate = (ICE Swap Rate) - (Inflation Index)
IBA will publish the daily index values at approximately 8AM New York time based upon yesterday’s closing prices in the Treasury and swaps markets.
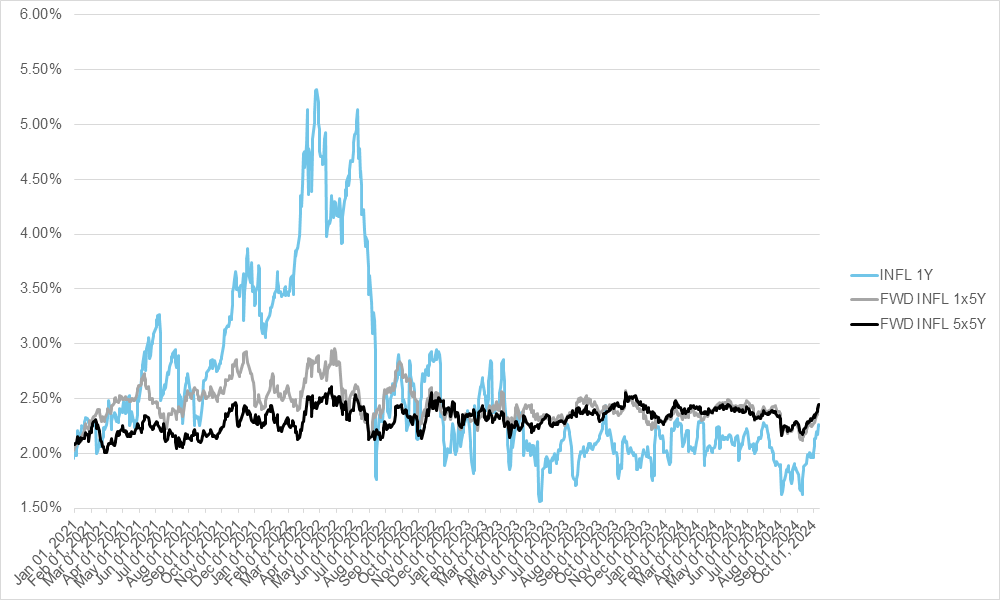
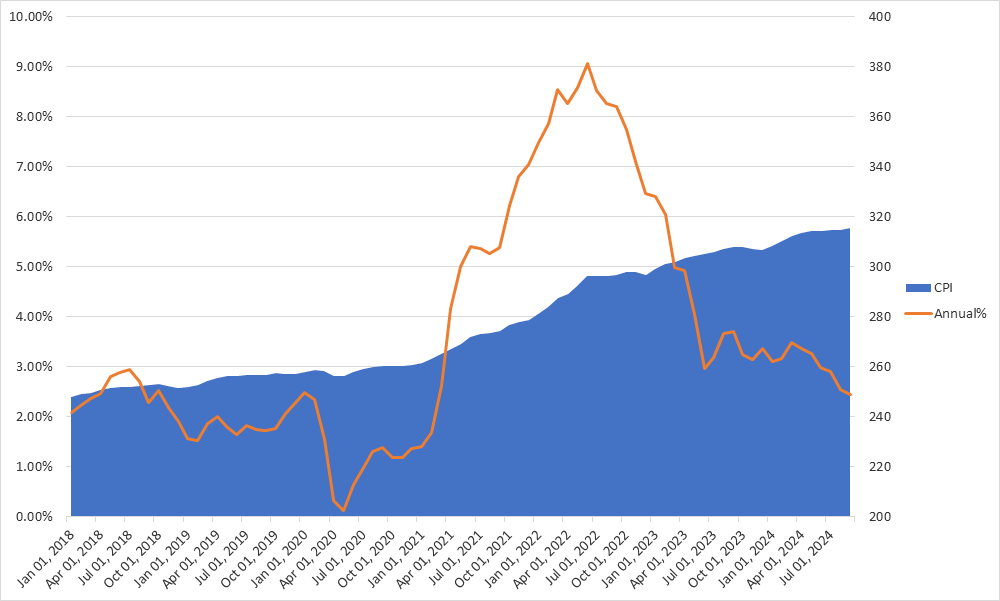
The charts below provide the historical Index settings since January 2021 and actual CPI over recent years:
Historical chart of the ICE U.S. Dollar Inflation Expectation Indexes
Historical chart of CPI values3
1 What an investor would earn above or below inflation (i.e., delivered CPI) if they held the TIPS to maturity.
2 The weighting of TIPS derived vs Swap derived prices in the calculation of the CPI projection will be determined by ICE based upon our estimate of trading activity in the respective markets. Initially this ratio was set at 3:1 (weighting of TIPS and treasury prices is three times greater than inflation swaps prices).
3U.S. Bureau of Labor Statistics, Consumer Price Index for All Urban Consumers: All Items in U.S. City Average.