Monday, Jul. 15, 2024
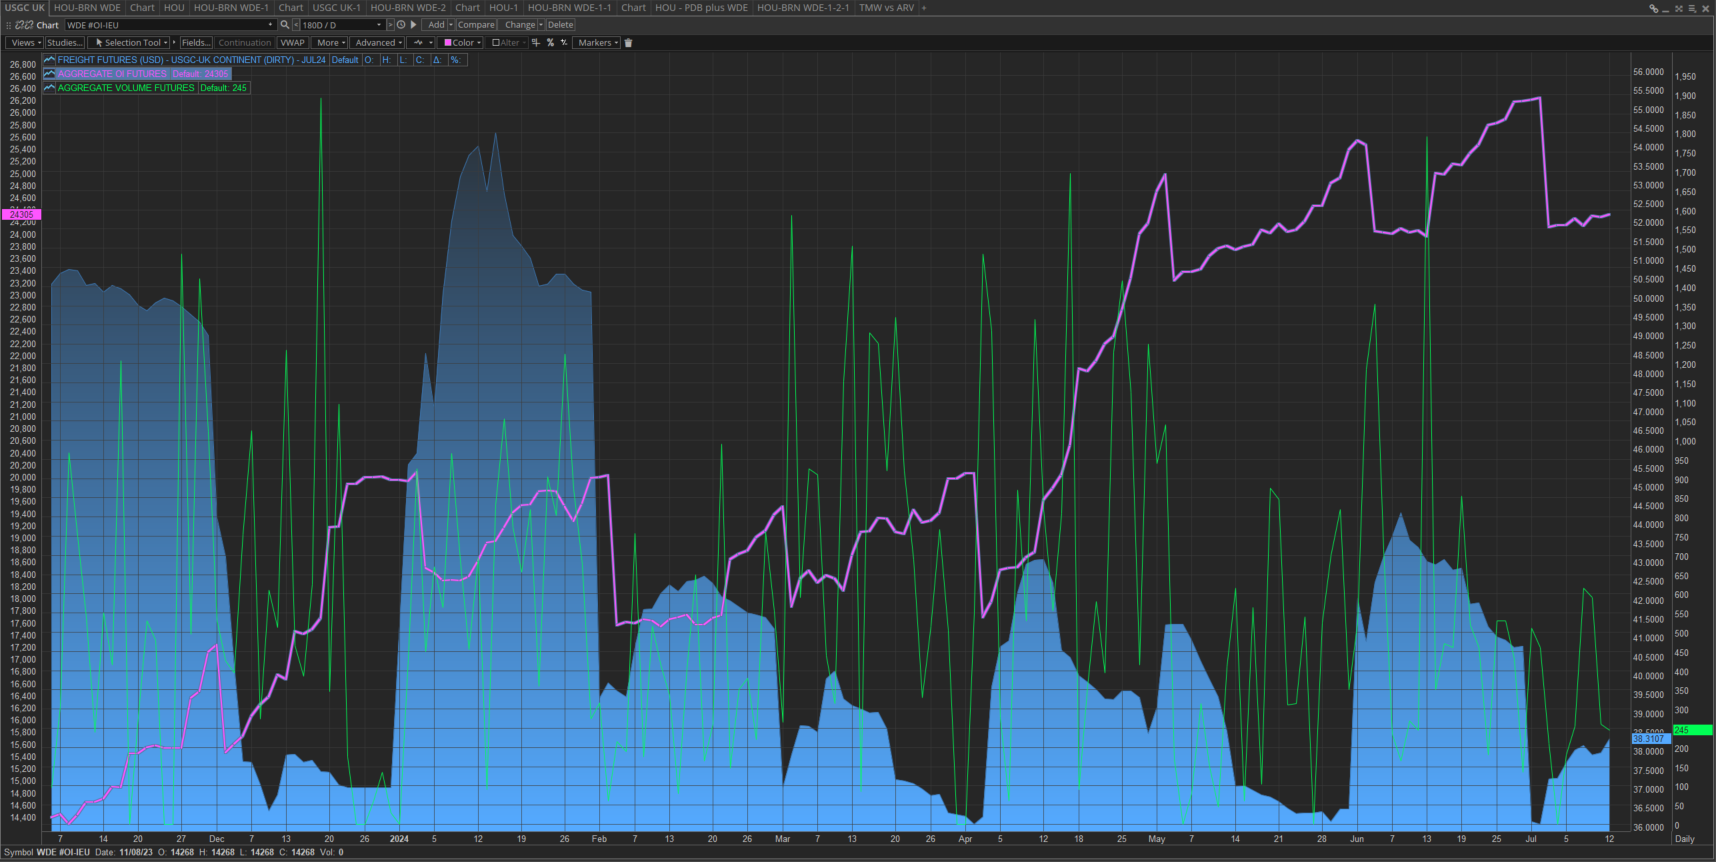
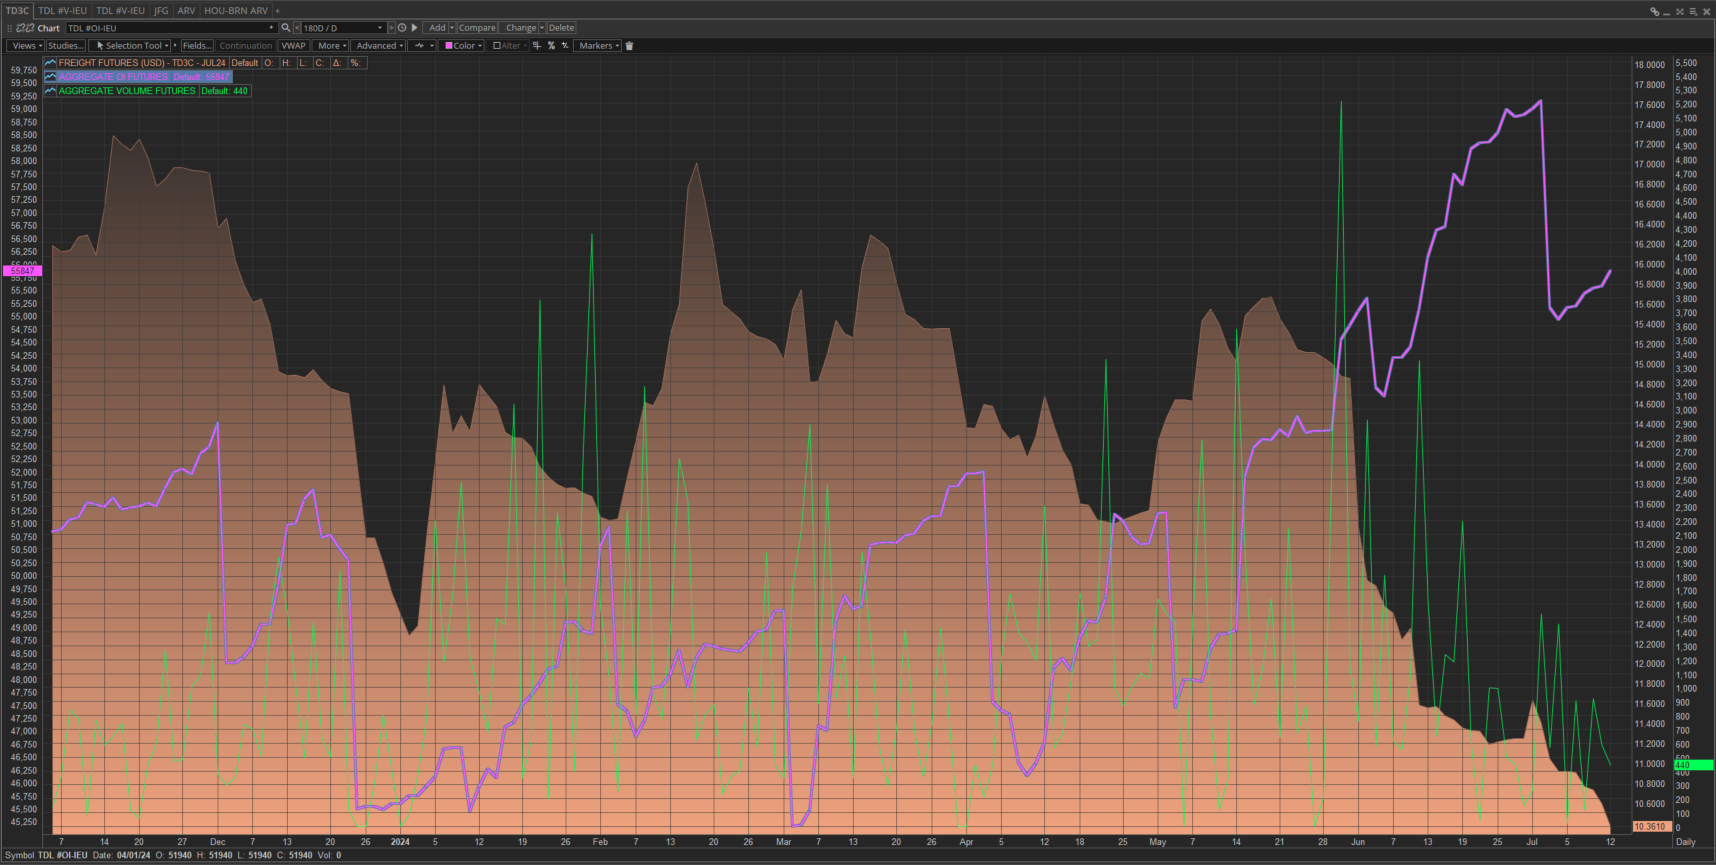
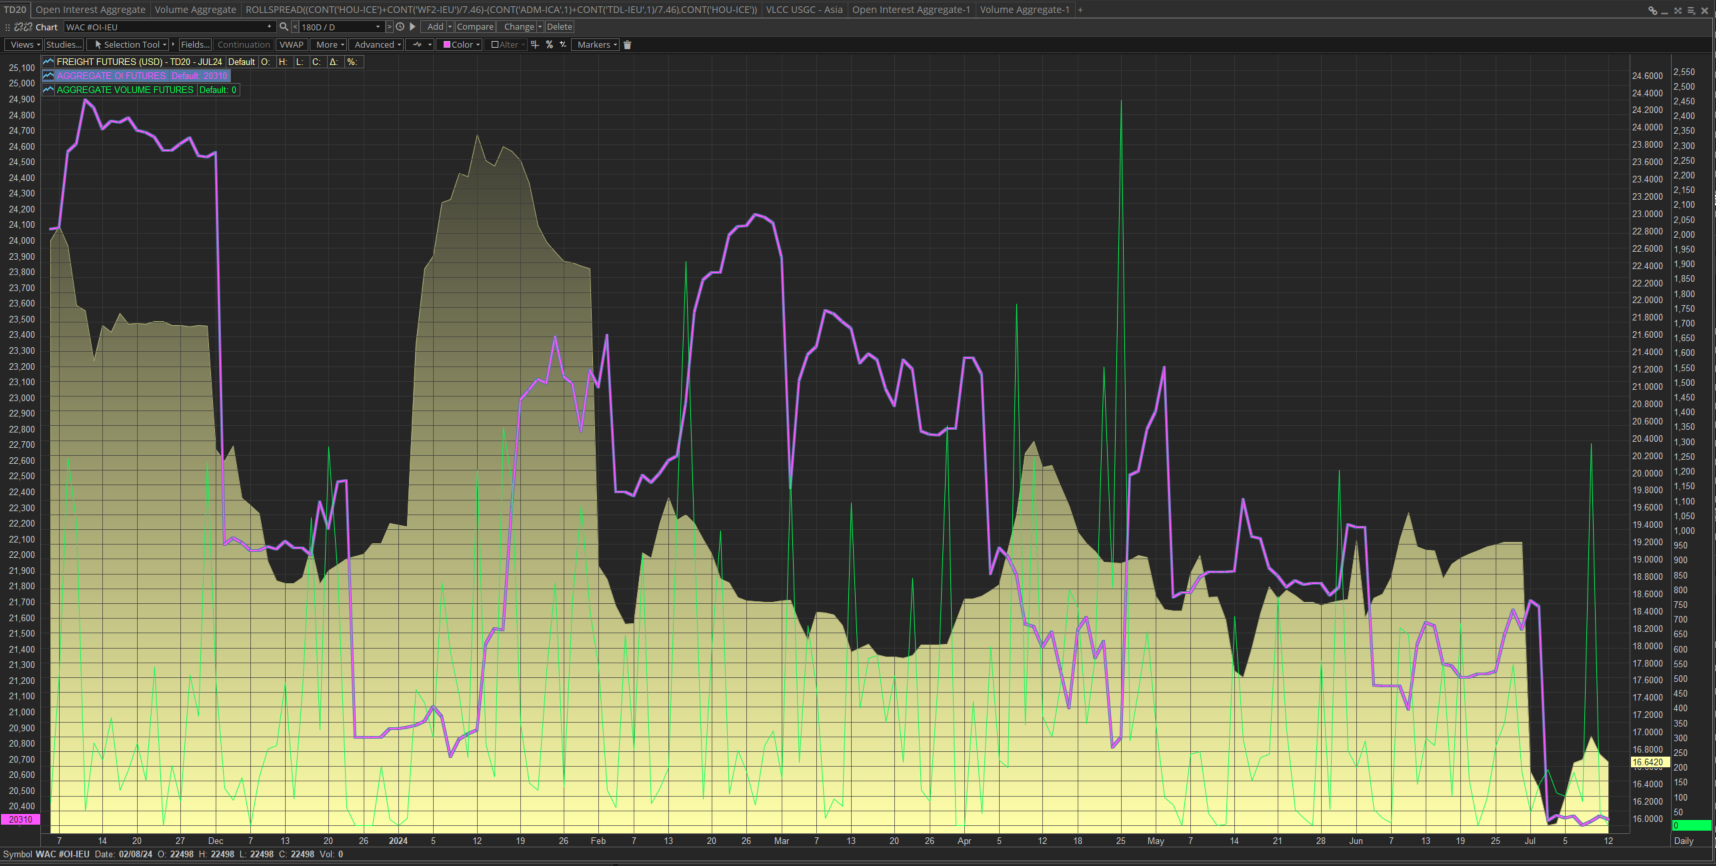
Chart represents last 6 months of price (shaded region), open interest (pink line), and volume (green line) of 3 largest dirty freight FFA.
Lower end on price across the board while WDE an TD3C OI continue to rise.