Friday, Oct. 11, 2024
How data can help municipal bond market participants
Hurricanes Helene and Milton recently struck the U.S. Southeast and Gulf Coast, highlighting the physical climate risk exposure of municipalities and their associated debt securities. These powerful storms posed immediate threats through destructive winds and flooding, emphasizing the urgent need to apply advanced data capabilities to navigate financial risks. By managing this exposure, stakeholders can better prepare for future disasters, ensuring the resilience of communities and financial assets.
Just two weeks ago, Hurricane Helene had a devastating impact on local communities in five states—Georgia, North Carolina, South Carolina, Tennessee, and Virginia. According to ICE Climate data, more than 300 entities with outstanding debt—including towns, cities, school districts, counties, and hospitals—were exposed to flooding, linked to over 15,000 municipal debt securities.
Two maps created by the ICE Climate team illustrate the extent of the exposure:
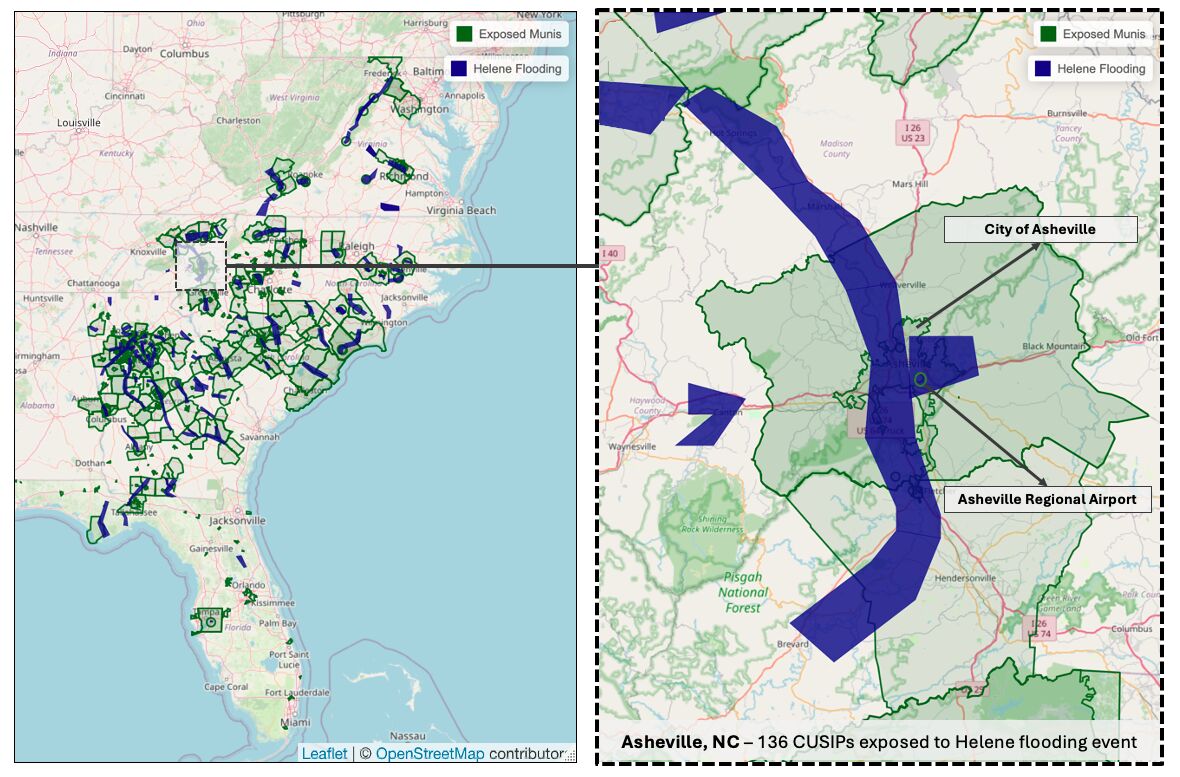
The map was created on Wednesday, October 9, based on the forecasted storm path at that time.
Flooding and Municipal Bond Exposure (Left): This map shows the flood boundaries during Hurricane Helene (in blue) and intersecting municipal locations (in green), using data from the National Weather Service and NOAA, integrated via ICE’s geospatial platform.
Taking a Closer Look (Right): A closer look at Asheville, NC (above) shows 136 municipal securities (CUSIPs) tied to areas exposed to flooding.
As recovery from Helene began, Hurricane Milton quickly emerged as a second threat to Florida. On the maps below, the municipalities and other entities (hospitals, charter schools, etc.) with outstanding debt that were potentially exposed to high winds shown on the maps below.
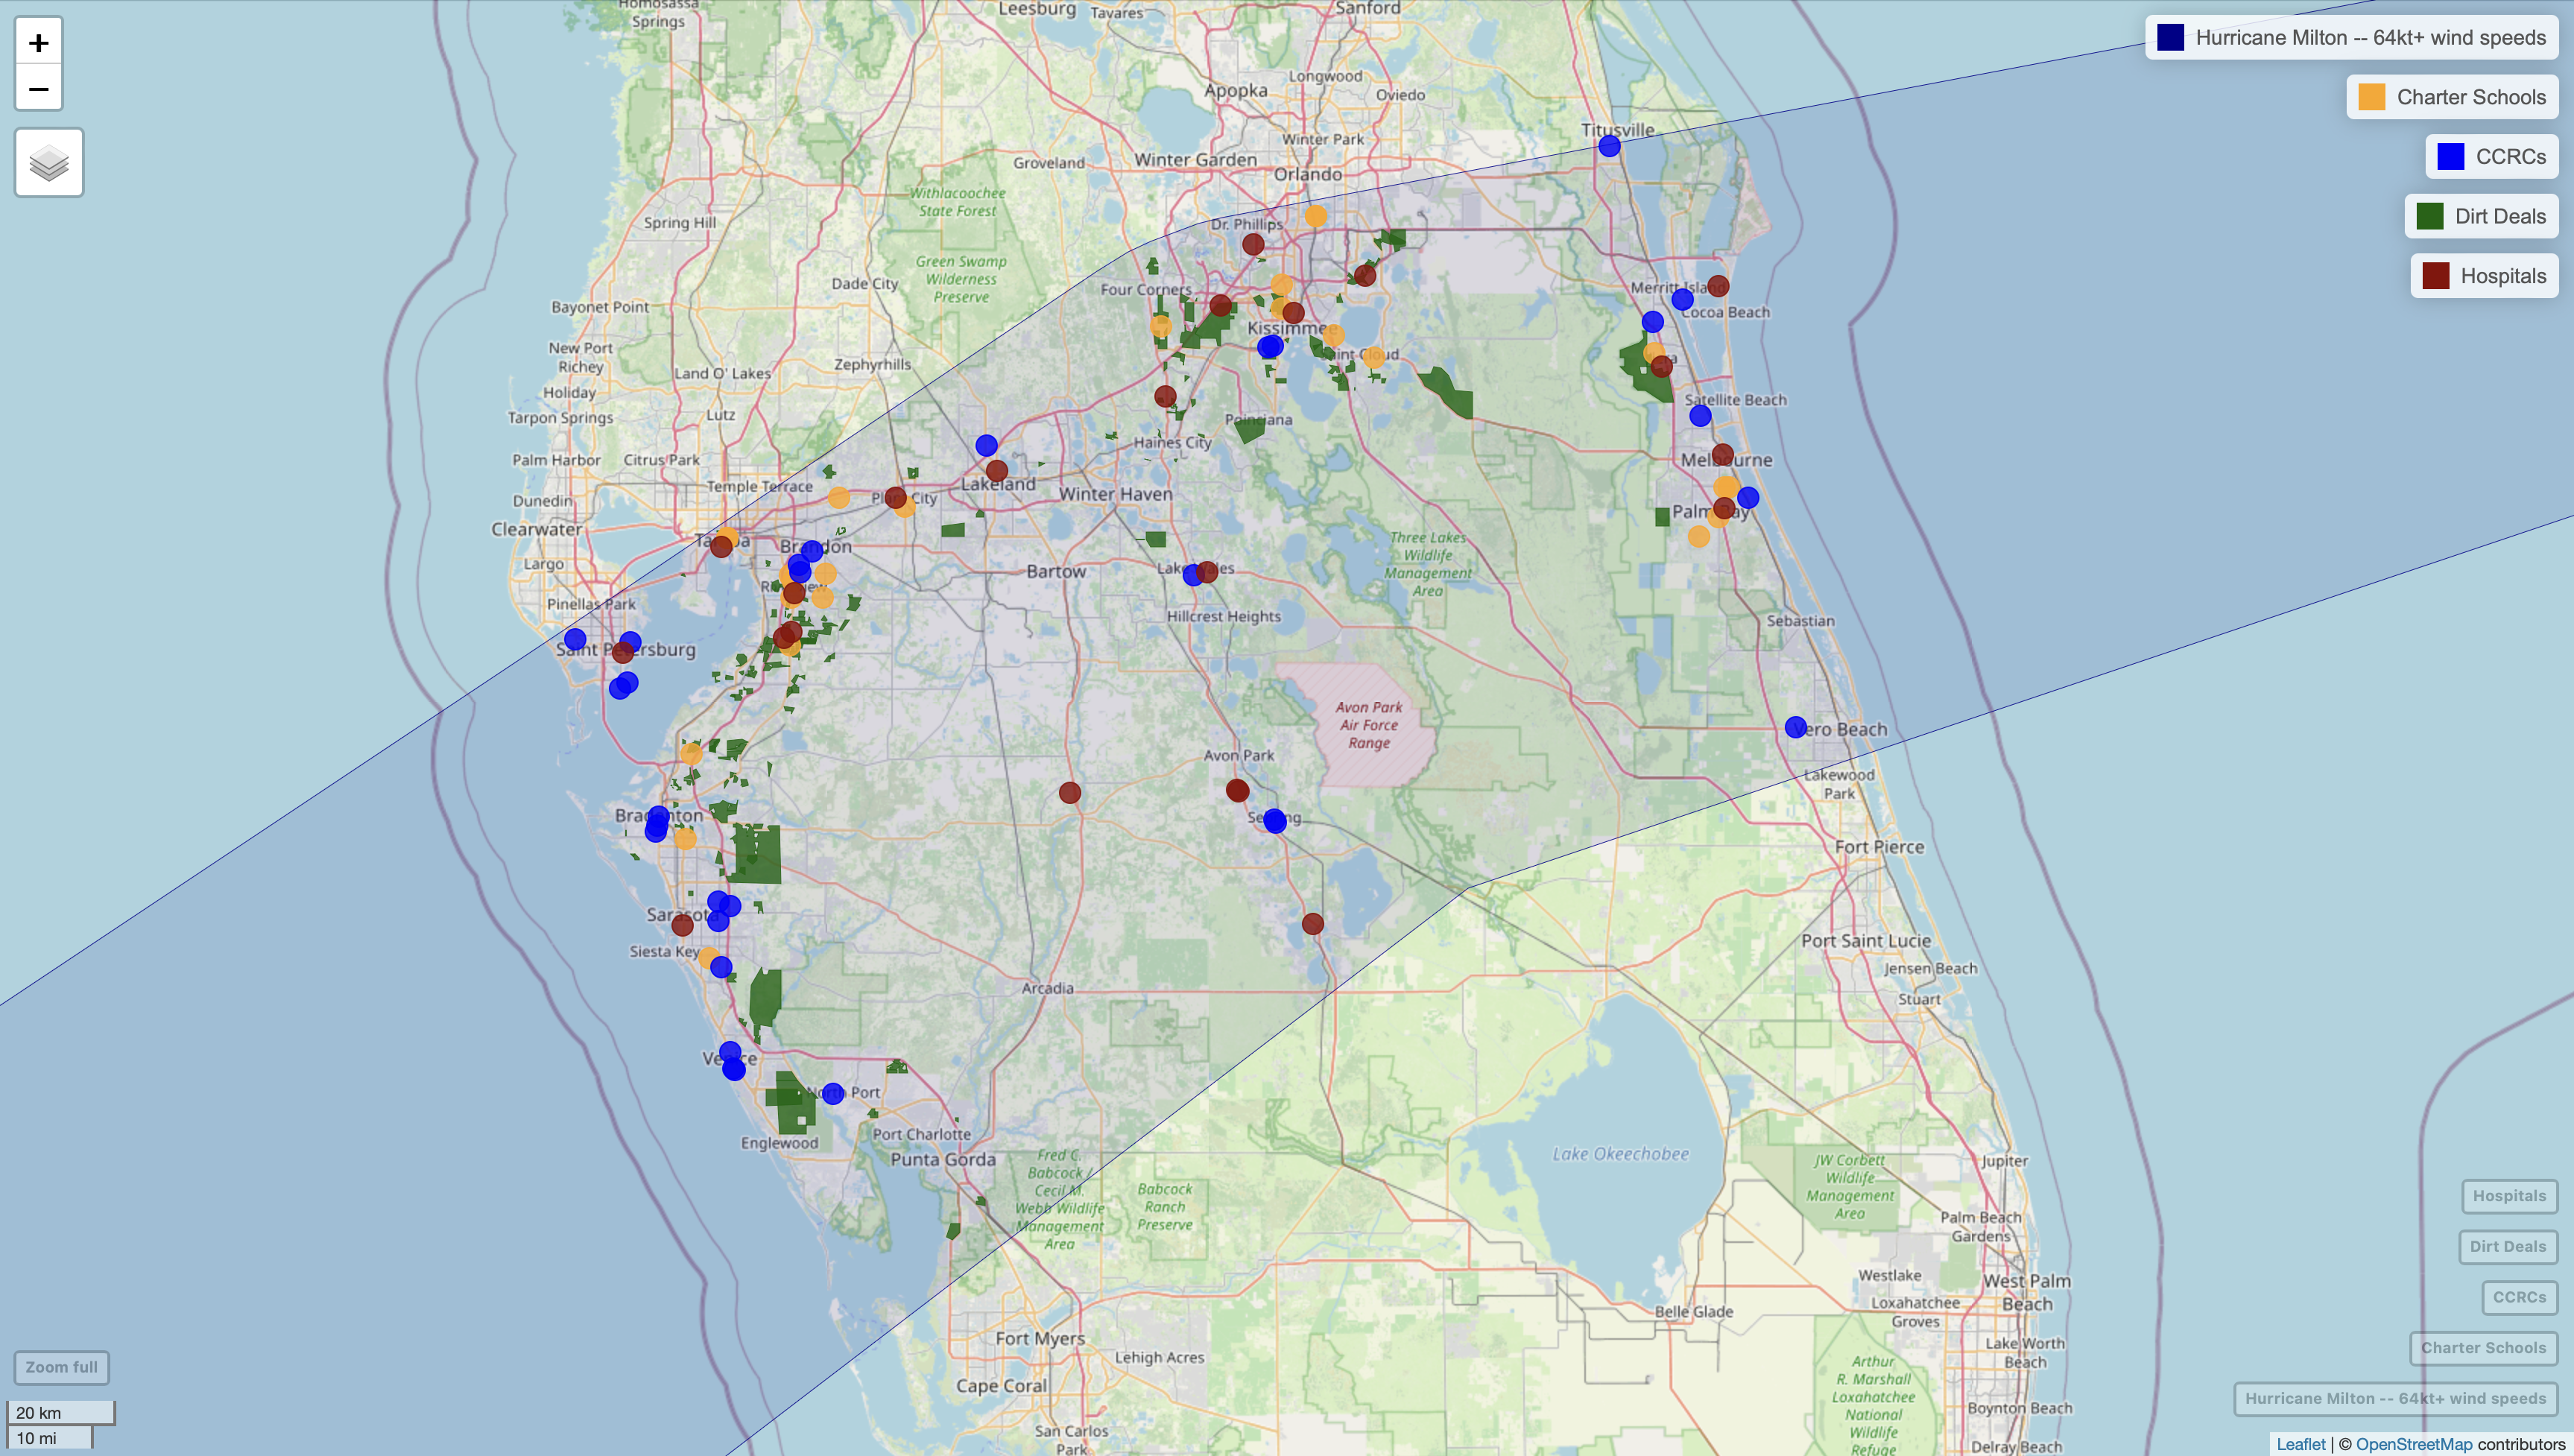
The map was created on Wednesday, October 9, based on the forecasted storm path at that time.
Municipal Boundaries and Asset Locations: This map displays municipal boundaries and asset locations overlapping with Milton’s projected hurricane-force wind speeds (at least 64 knots / 74 mph), marked in blue.
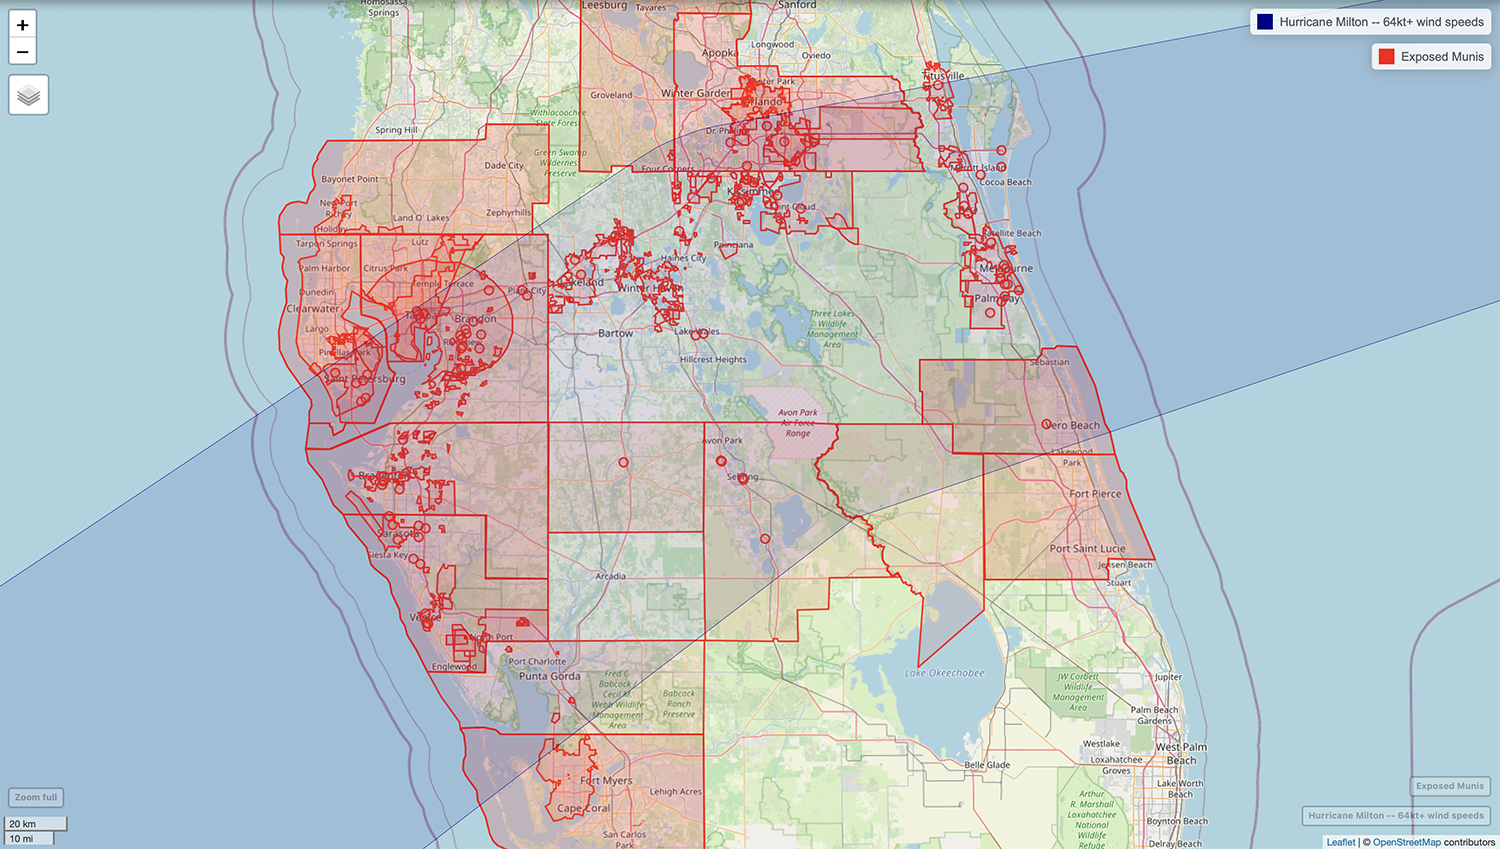
The map was created on Wednesday, October 9, based on the forecasted storm path at that time.
Sector Exposure: This map categorizes locations by sector, identifying those most at risk, including Community Development Districts (CDDs), Charter Schools, Continuing Care Retirement Communities (CCRCs) and Hospitals.
Overall, ICE's analysis indicated that nearly 400 municipal issuers and ~9,000 municipal securities were potentially exposed to hurricane-force winds in Hurricane Milton.
The challenges posed by Hurricanes Helene and Milton underscore the need for municipalities and market participants to understand and manage their vulnerabilities. By using advanced data capabilities, stakeholders can better prepare for and respond to these disasters, ensuring community resilience and financial stability.
Our research team is available for discussions to provide additional support. Please read ICE Climate Analytics for Municipal Debt for more information.