
State and local governments face increasing climate-related risks. According to a report by Municipal Market Analytics in March 2024, the need for climate adaptation investment could lead to a 100% increase in annual municipal bond issuance by the mid-2030s. Climate vulnerability, socioeconomic factors, and underinvestment may lead to a 'debt-climate trap’ whereby the cost of borrowing to address climate risks may become increasingly unaffordable for some issuers.
Tom Doe, Founder & President, Municipal Market Analytics, Inc., talks about how climate is impacting the markets
Historically, federal disaster relief has bolstered investor confidence and prevented bond impairment. However, funding for repairs like those needed for the Oroville Dam has faced uncertainty. By the end of 2022, the National Flood Insurance Program was $20.5 billion in debt and had paid over $5 billion in interest since Hurricane Katrina. Rising insurance premiums and insurer exits from high-risk areas may also shrink municipal tax bases.
Identify exposure to climate events in real time
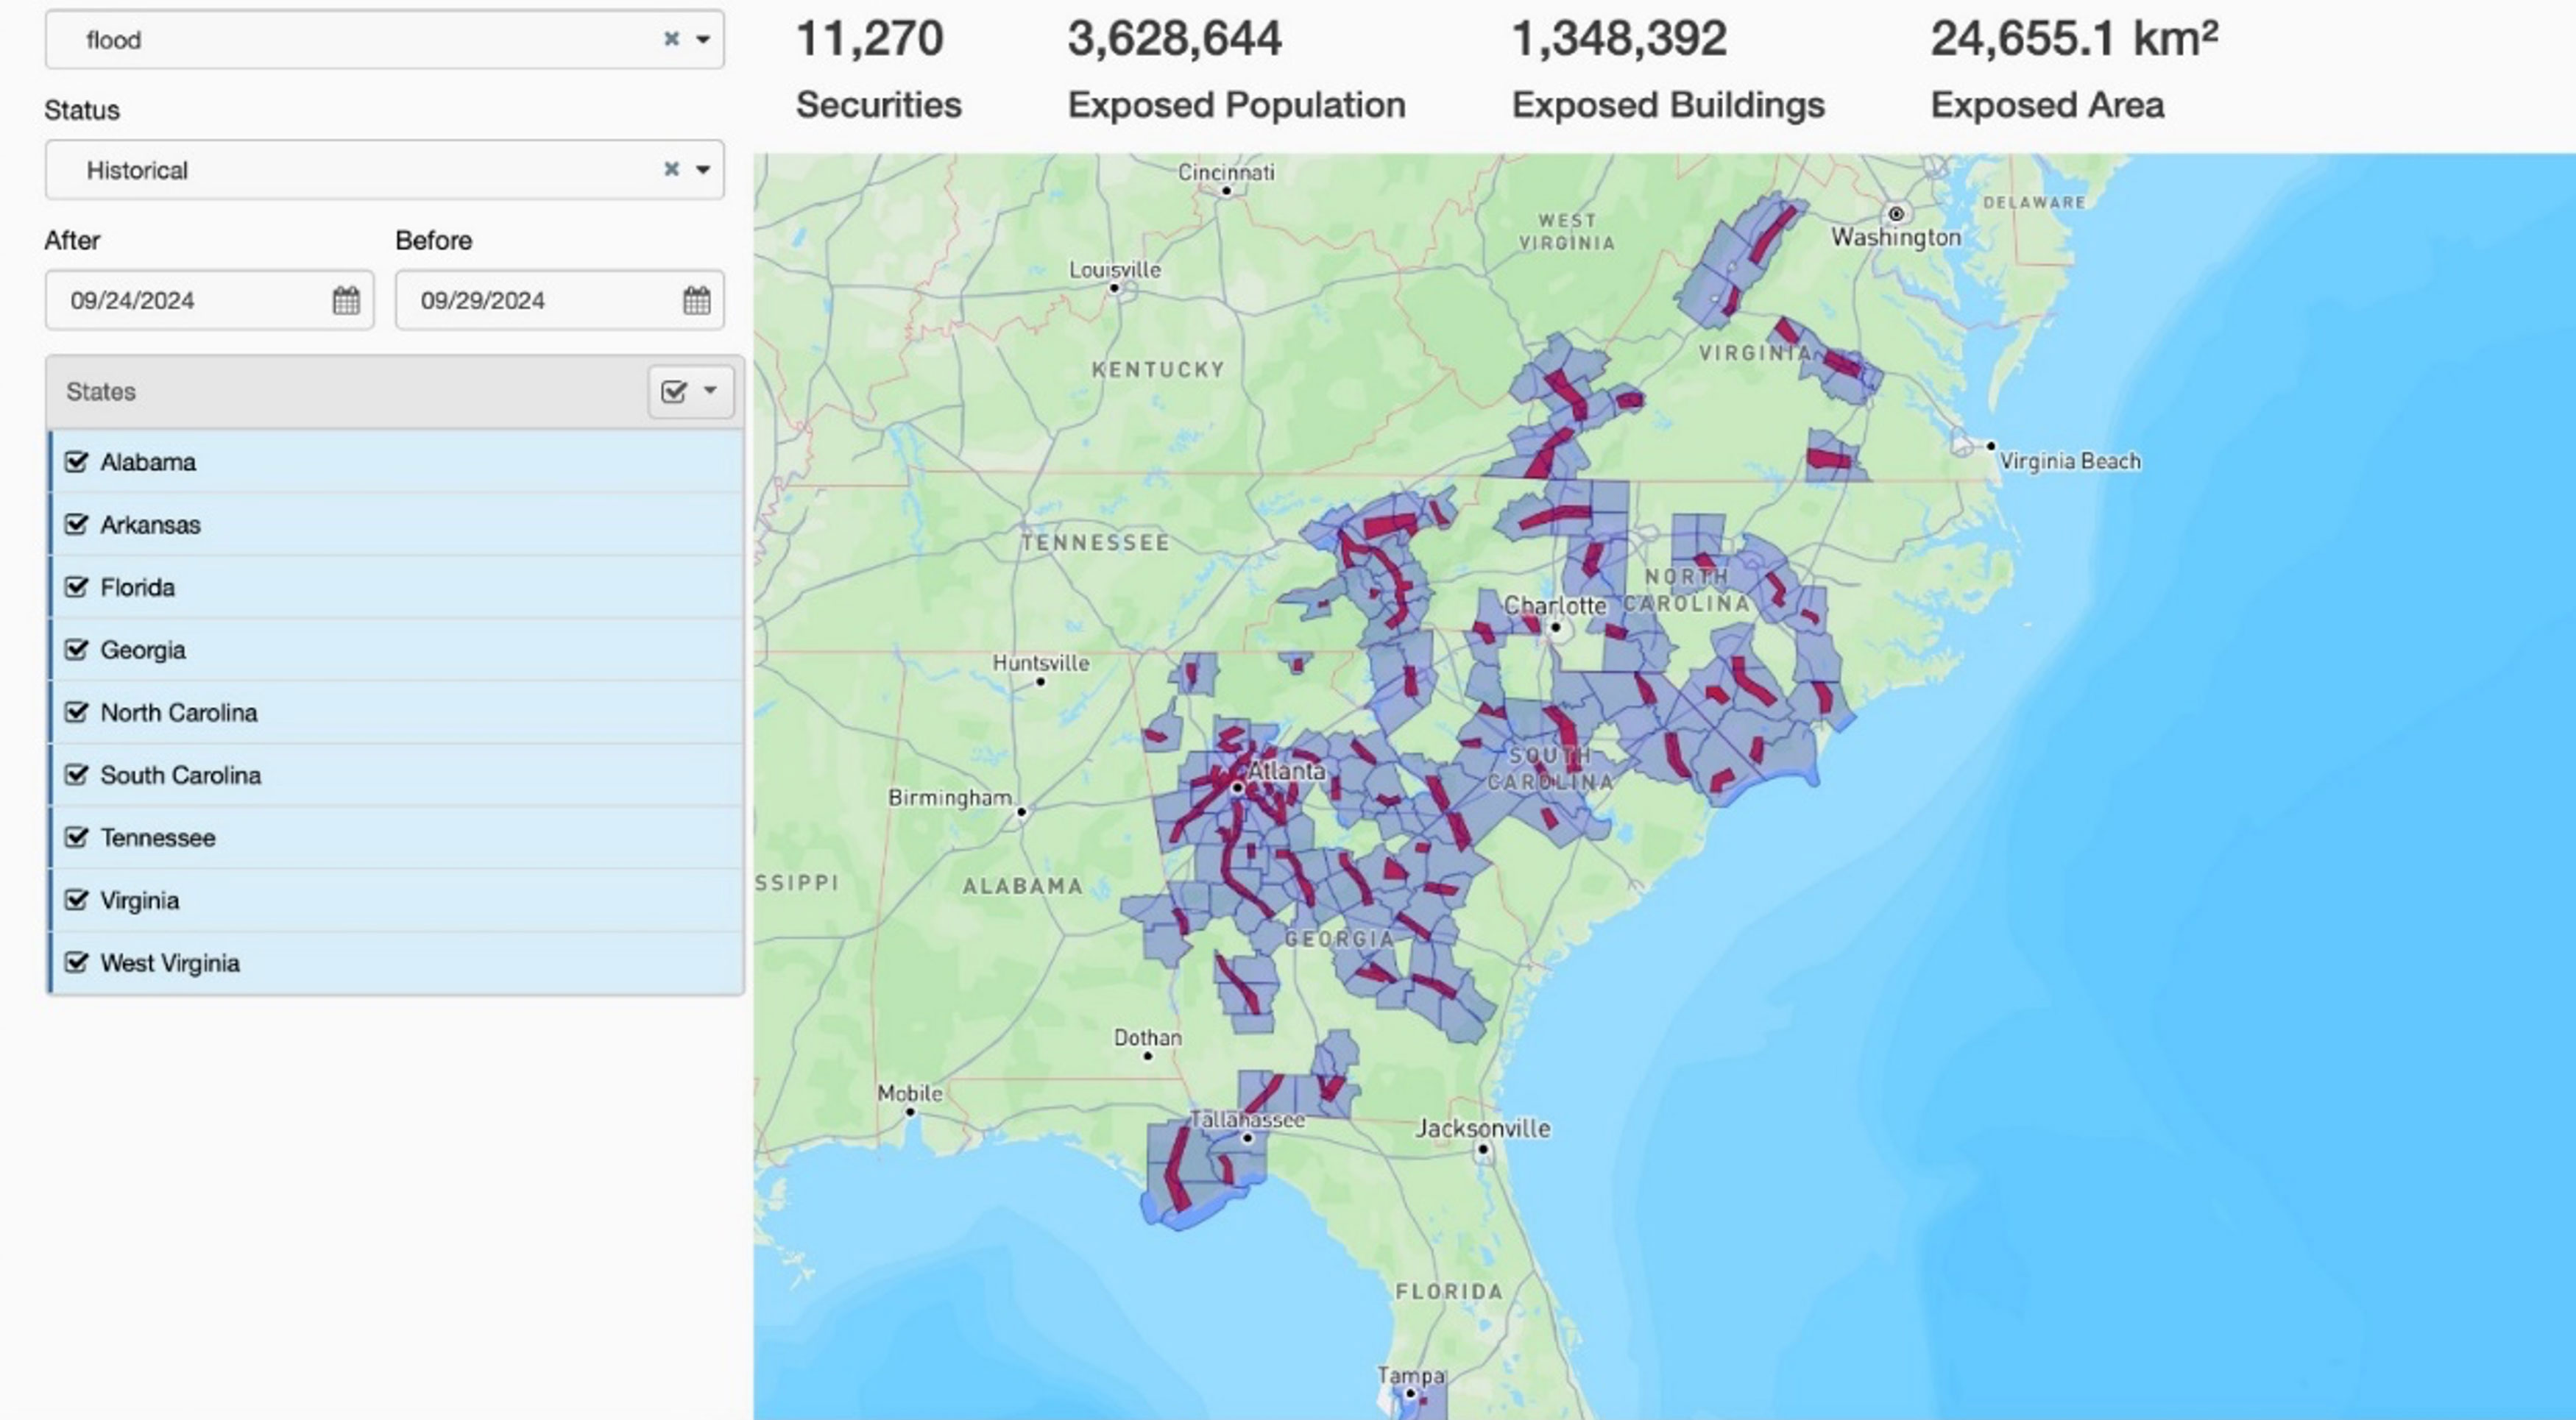
Hazard Watch is a new tool that enables clients to assess municipal issuer exposure to extreme weather events like hurricanes, wildfires and inland and coastal floods. We will be expanding our exposure analysis to additional asset classes such as Corporates, Sovereigns, and Mortgage-Backed Securities (MBS) in subsequent releases. With the interactive mapping you can assess current and historical event exposure, including locations of exposed municipalities, service areas and other obligated entities:
- Monitor several types of natural hazards: assess the impacts of hurricanes, wildfires and floods with user-defined criteria
- Understand the impact of natural hazards: exposure metrics including counts of CUSIPs, estimated counts and value of exposed buildings, and estimates of residential and working populations that are exposed to an event
- Assess active or historical events: exposure metrics from historical events in addition to current hazards
- Export security-level data exports: users can export CUSIP-level data – including exposure metrics and hazard event information – for specified hazard types and data ranges
Get data and analytics on active climate events
View current and historical natural hazard exposure metrics and information using Hazard Watch.
Geospatial intelligence
Our climate risk metrics can be used by credit analysts, portfolio managers, and wealth managers to quantify risks and build investment strategies. Developed using catastrophe modeling, these metrics combine hazard models with economic and property data to estimate financial losses. They offer obligor-specific insights based on detailed geospatial data, covering about 92% of the U.S. municipal debt market. The ICE Climate Risk Score, ranging from 0 to 5, assesses securities and portfolios across Flood, Wildfire, and Hurricane risks. Weekly alerts provide further insights.
Access The ICE Climate Risk Score, a unified metric on a scale of 0 to 5 used to compare securities and assess portfolios using a combination of underlying Flood, Wildfire and Hurricane Scores.
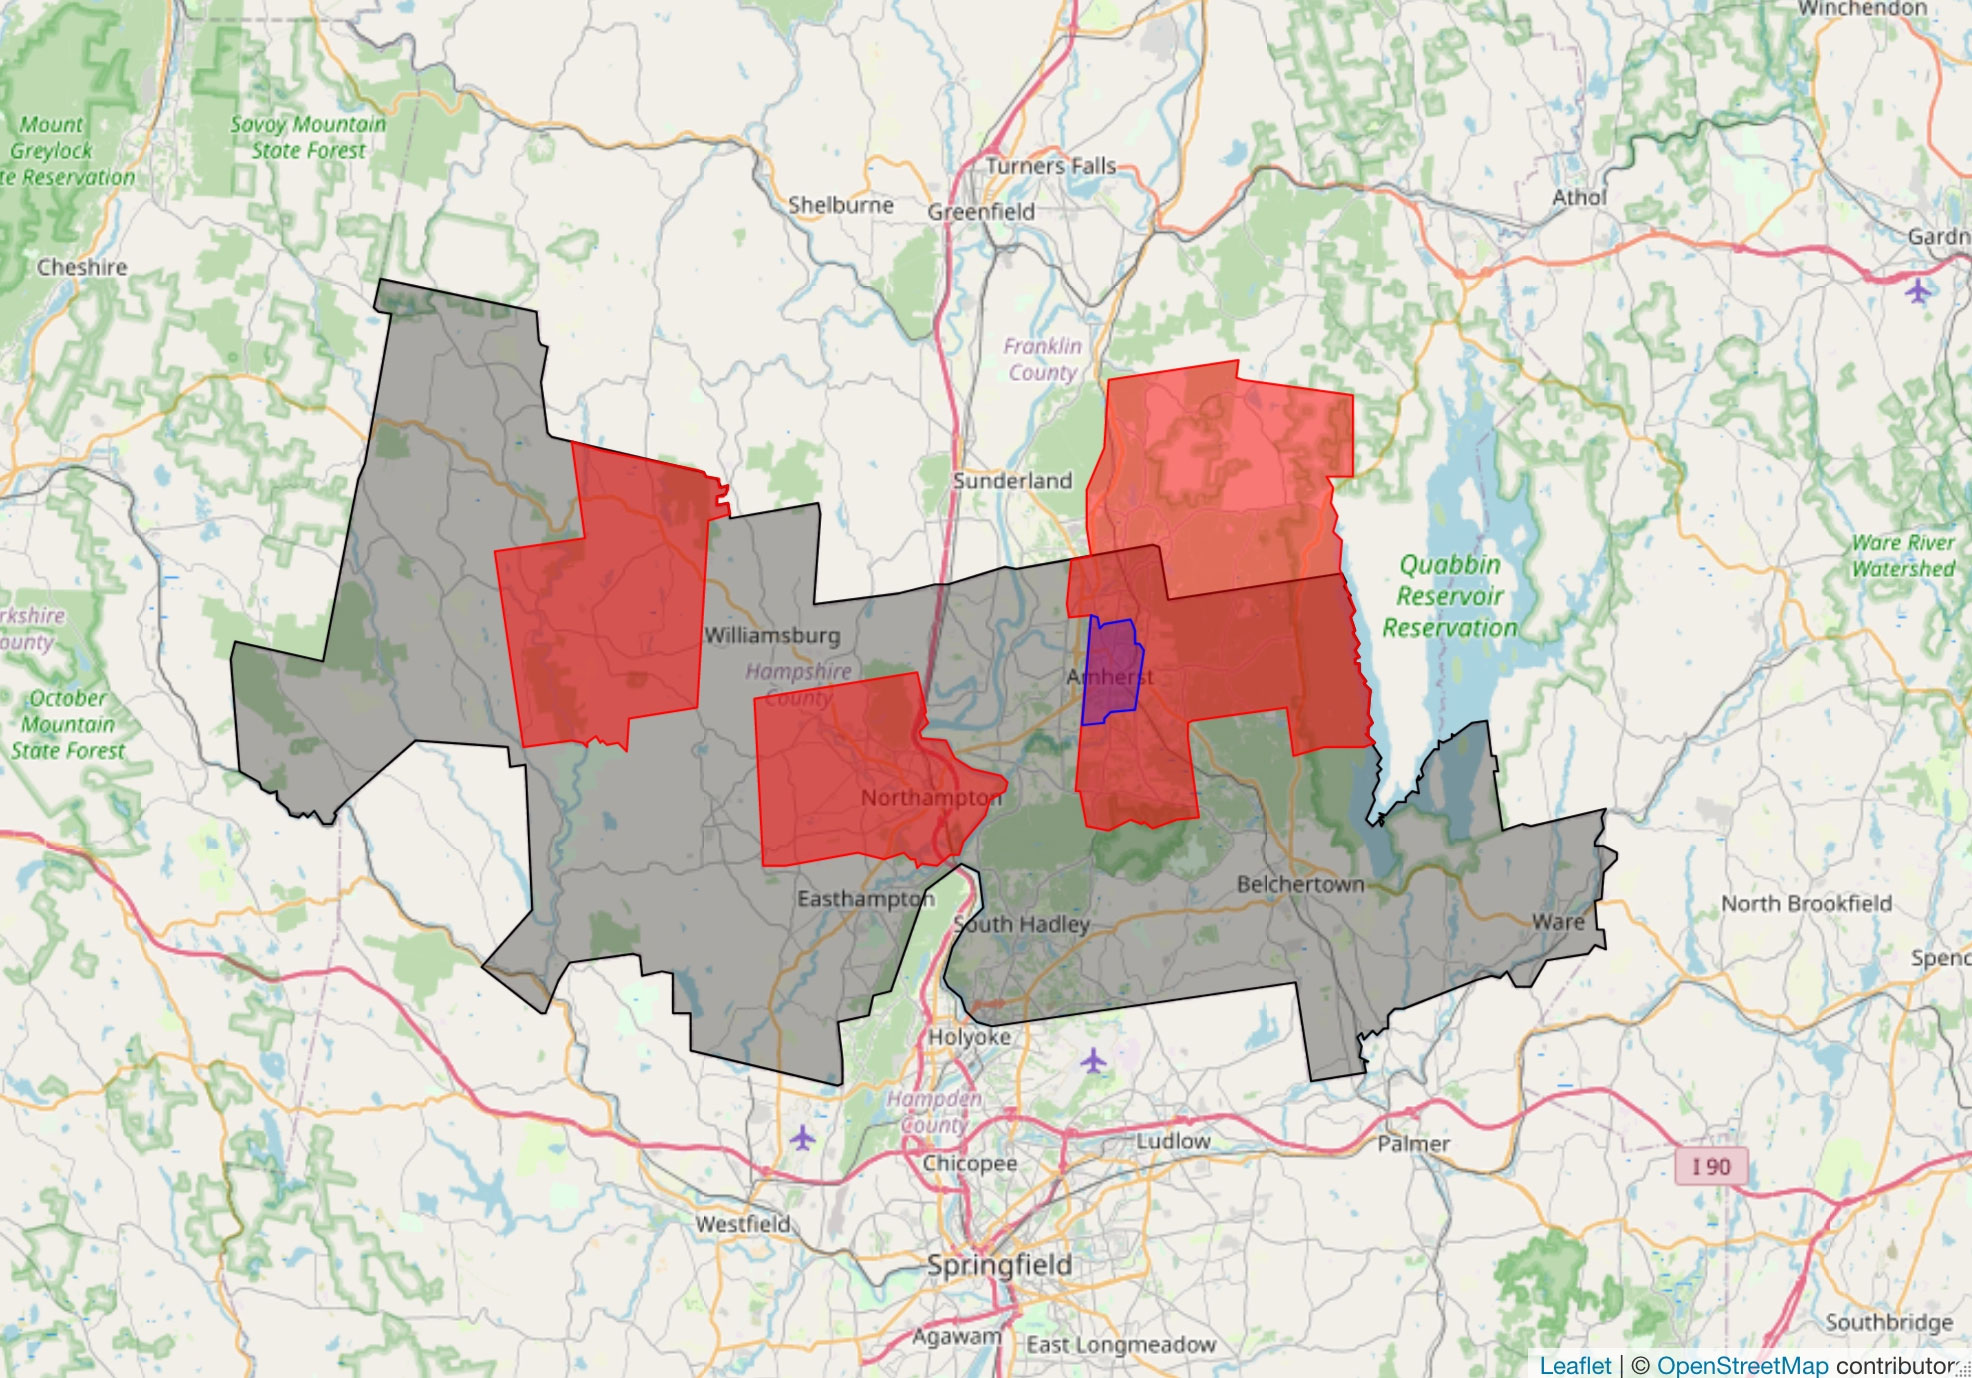
Municipal geospatial library and security linkage
The power and versatility of this geospatial library is difficult to understate. It enables a suite of different applications, including:
Overlapping debt burdens
The ICE Climate team can use overlapping obligor boundaries and their associated outstanding CUSIPs to estimate the total debt burden of any given community. Municipal debt burdens are often provided by issuers in bond disclosures, but these figures are often non-standardized and difficult to compare across issuers.
Bespoke spatial boundaries
ICE Climate can link any spatial boundary of interest to CUSIPs with overlapping spatial footprints. This can be useful when assessing the implications of various event-based risks for the municipal bond market.
Socioeconomic characteristics
Detailed information about the geographic boundary associated with a security allows ICE Climate to provide CUSIP-linked information about the socioeconomic characteristics of obligated communities.
Climate risk metrics
Detailed information about the geographic boundary associated with an issuer allows ICE Climate to provide CUSIP-linked information about the climate risk of obligated communities.
Related insights
Municipal bonds in congressional districts
A partnership between ICE and the University of Chicago to analyze tax-exempt municipal bonds in communities across the country.
Chronic climate perils and stranded communities
What could happen to communities and the municipal bond market if portions of the U.S. become unlivable?
Linking municipal bond securities to their geospatial footprints
By some estimates, over 90% of local and state capital spending is funded by municipal bonds in the United States.
Municipal bond markets: the implications of rising inland flood risk
In 2011, just west of Albany, New York, Tropical Storm Irene dumped 16 inches of rain on the Schoharie Valley in just 24 hours.
How municipal bond insurers underwrite for decades of extreme weather risk
A conversation with Jamie Shilling, Deputy Chief Credit Officer at BAM Mutual, on long-term natural hazard risk.