
MACRO COMMENTARY
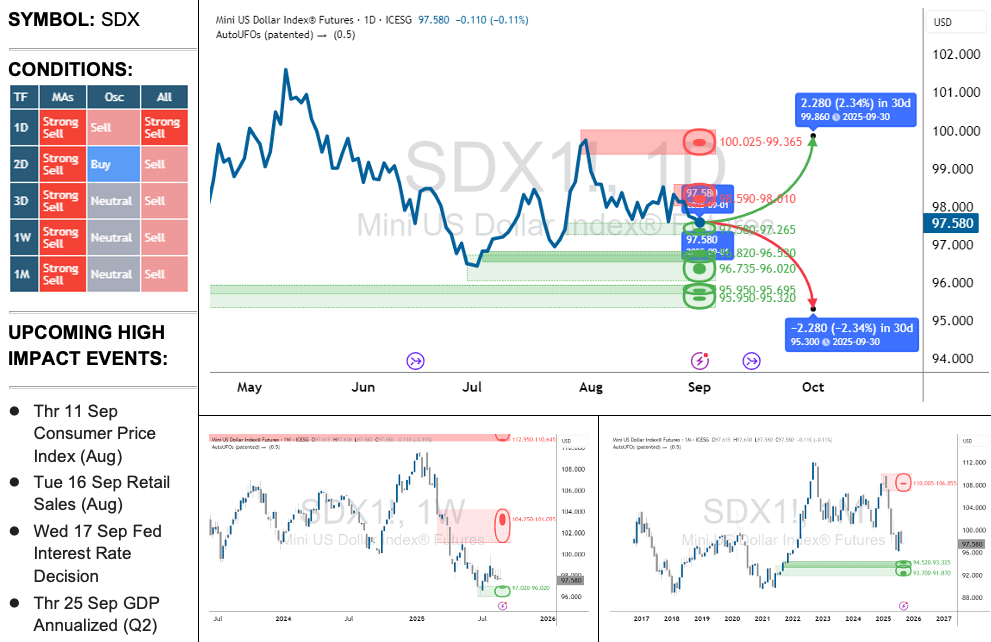
The MINI U.S. DOLLAR INDEX ® FUTURES (SDX) closed August down 2.17% at 97.66, after reaching a high of 100.03. This decline was largely influenced by a series of mixed economic data releases that created uncertainty in the market.
- Nonfarm Payrolls rose by 73,000 jobs in July, missing market expectations of 110,000. The unemployment rate rose to 4.2% in July, a slight increase from 4.1% in June and was still holding within the narrow range of 4.0% to 4.2% since May 2024. Average hourly earnings increased by 0.3% in July, a slight uptick from June’s 0.2% advance, matching expectations, with annual wage growth at 3.9% up from the prior month's 3.8%, suggesting that wage inflation remained resilient even as job growth slowed. The SDX closed at 98.82, with a 1.02% loss on the day.
- Annual Core Inflation, excluding food and energy, rose to 3.1% for the 12 months ending in July, from 2.9% in June. The Consumer Price Index (CPI) for the same period remained steady at 2.7%, just short of expectations. The SDX closed at 97.84, with a 0.51% loss on the day.
- The July FOMC minutes showed that officials chose to hold the federal funds rate at 4.25% – 4.50%. The Fed cited economic uncertainty and highlighted a split within the committee between those focusing on persistent inflation worsened by tariffs and those more concerned with labor market weakness. The statement reaffirmed their commitment to achieving maximum employment and returning inflation to 2%. The SDX closed down 0.24% at 98.00 on the day.
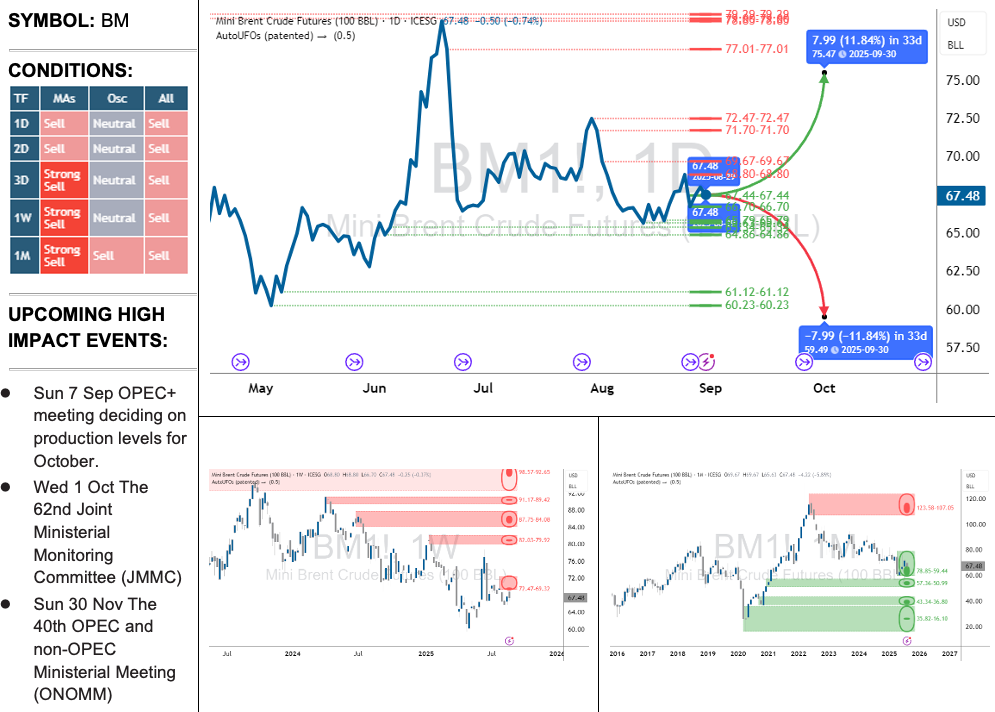
The MINI BRENT CRUDE FUTURES (BM) traded within a range, holding above the key support level of $65.00 and staying below the $73.00 resistance level nearly tested in late July. The contract ended August at $67.48, marking a 4.22% decline from the previous month’s close of $71.20.
- OPEC+ was set to fully unwind its 2.2 million barrels per day in voluntary production cuts by September. However, rising concerns over a potential supply glut contributed to downward pressure on oil prices. This, coupled with subdued summer driving demand in the United States, suggested that near-term prices are likely to remain weak. With future prices trading higher than current levels, the market exhibited a contango structure.
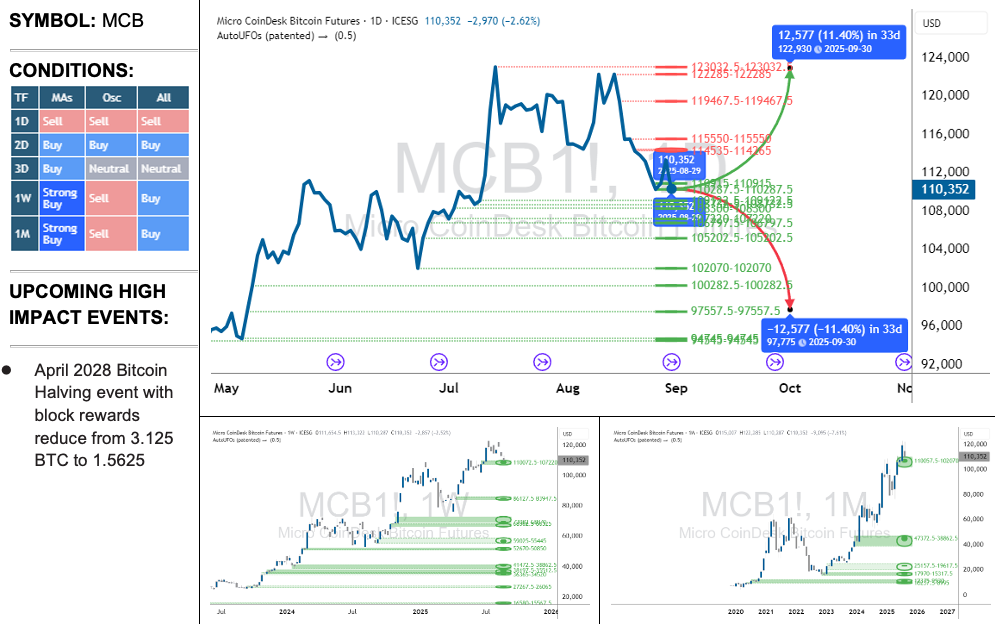
The MICRO COINDESK BITCOIN FUTURES (MCB) took a breather following July’s fresh contract highs of $123,032, retreating to end August at $110,352 - a 7.6% decline from the previous month’s close, snapping a streak of five consecutive monthly gains.
- With global macroeconomic headwinds intensifying, central banks have begun cutting interest rates. At the same time, spot-bitcoin exchange traded funds (ETFs) experienced outflows, while major holders (“whales”) trimmed their positions. A key event occurred on August 24, when the sale of 24,000 bitcoins triggered a sharp flash crash and, according to some reports, led to roughly $500 million in leveraged liquidations.
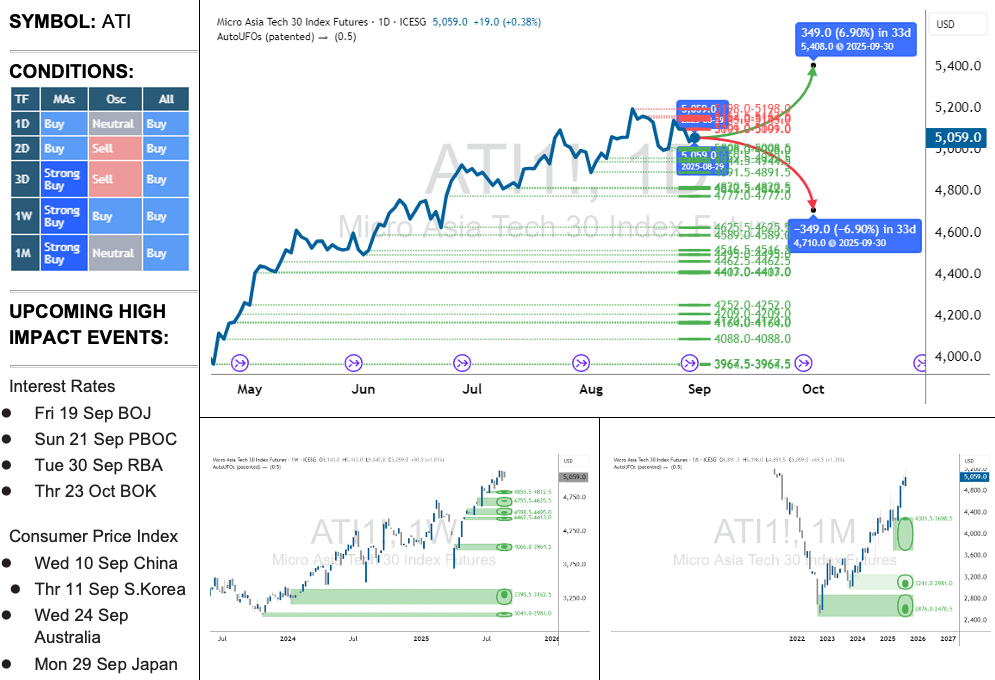
The MICRO ASIA TECH 30 INDEX FUTURES (ATI) marginally sustained their upward trajectory in August, closing the month at $5,059 - marking a 1.4% gain from July’s close of $4,990.
- Taiwanese stocks displayed a strong bifurcation in August. Quanta Computer slipped by 6.70%, while ASE Technology Holding edged down by 1.00%. In contrast, Delta Electronics surged by 25.40%, leading gains in the sector. Hon Hai Precision Industry also performed robustly, climbing 14.30%. Taiwan Semiconductor Manufacturing held steady with no change, and MediaTek likewise remained flat.
- Japanese equities produced a mixed but generally positive outcome. FUJIFILM Holdings delivered a solid gain, rising 11.20%. Fujitsu Limited followed suit, advancing 8.20%. Sony Group Corporation climbed 10.90%, and Advantest Corp. Technology posted the strongest gain among Japanese tech players at 12.80%. Murata Manufacturing edged up 7.30%, Keyence Corporation added 2.90%, Lasertec Corp. Technology inched ahead by 0.90%, and Canon Inc. rose 1.20%. Nintendo delivered a moderate gain of 4.90%. On the downside, DISCO Corp. Technology declined 9.20%, and Tokyo Electron tumbled significantly, down 24.40%.
- In China, performance was notably mixed with some high volatility. Tencent Holdings gained 8.50%, and Baidu, Inc. also rebounded, advancing 5.70%. NetEase added 3.90%, while Alibaba Group remained unchanged. On the downside, Kuaishou Technology dropped 2.10%, Xiaomi Corp. declined 0.60%, JD.com fell 4.10%, and Meituan plunged 15.50%.
- South Korean stocks experienced a general downturn in August. SK Hynix decreased 1.60%, Samsung Electronics declined 2.40%, and LG Energy Solution posted the steepest loss at 8.00%.
- Australia’s representation in the ATI registered a sharp decline. Wisetech Global plunged 14.70%, marking one of the weakest performances among all component stocks for the month.
MINI U.S. DOLLAR INDEX ® FUTURES
After reaching a high of 100.03 on August 1st, the SDX found resistance and pulled back. The U.S. Dollar's weakness accelerated following the release of worse-than-expected Nonfarm Payrolls and disappointing ISM manufacturing data, which missed expectations. The SDX closed down 1.02%, marking its sharpest single-day drop of the month. Despite this disappointing end to the week, the SDX closed the week up 0.96% at 98.82. During the week of August 4th, demand for the U.S. Dollar continued to weaken but stabilized midweek as the SDX approached the midpoint of the daily Bollinger Bands, resulting in largely sideways trading for the rest of the week. The SDX closed the week at 98.10, down 0.62%. The following week, the index barely skimmed a daily resistance area at 98.52 - 98.82, met resistance and pulled back. The SDX closed lower on August 12th, down 0.51% after mixed inflation data was released. However, it reversed a few days later, closing with a gain of 0.59% after the release of higher-than-expected Producer Price Index data, testing the midpoint of the daily Bollinger Bands before ending the week at 97.71 with a loss of 0.39%.
Early the following week, the index steadily climbed higher, although the SDX pulled back after the FOMC minutes were released on August 20th, closing down 0.24%. It later recovered, trading back through the midpoint of the daily Bollinger Bands before retesting the daily resistance zone of 98.52 - 98.82 on August 22nd. Upon reaching the resistance area, the bears drove the market lower, and the SDX closed at 97.85, down 0.73% for the day and 0.14% for the week. In the early part of the week of August 25th, demand for the U.S. Dollar returned, driving the SDX higher; the index retested the daily resistance area on August 27th before declining throughout the rest of the week, ending the week down 0.09%.
The Mini U.S. Dollar Index ® futures closed the month at 97.66, with a loss of 2.17%.
Daily indicators of SDX prices indicated strong sell signals based on the moving averages. The technical oscillators indicated mostly neutral conditions, which could prompt investors to consider waiting for a pullback before seeking trading opportunities. Using historical volatility, the price from the prior month’s close could range between 99.86 to 95.30 within the next 30 days. Investors or traders may consider the weekly support (97.02 to 96.02) or resistance areas (104.25 to 101.10) when planning their entries or exits, depending on their trading strategies. In July, the SDX remained in a downtrend in the weekly timeframe and reverted to an uptrend on the daily timeframe towards the end of the month.
| STATISTICAL VOLATILITY RANGES | STATISTICAL VOLATILITY RANGES | |||
|---|---|---|---|---|
| 21-day | 42-day | 63-day | Monthly (Min) | Monthly (Max) |
| 7.45% | 8.09% | 8.01% | ±2.099 | ±2.279 |
MINI BRENT CRUDE FUTURES
Mini Brent Crude futures (BM) traded within a range, holding above the key support level of $65.00 and staying below the $73.00 resistance level nearly tested in late July. The contract ended August at $67.48, marking a 4.22% decline from the previous month’s close of $71.20.
OPEC+ was set to fully unwind its 2.2 million barrels per day in voluntary production cuts by September. However, rising concerns over a potential supply glut are contributing to downward pressure on oil prices. This, coupled with subdued summer driving demand in the United States, suggested that near-term prices are likely to remain weak. With future prices trading higher than current levels, the market exhibited a contango structure.
Daily technical indicators of oil futures (BM) prices indicated strong selling market conditions. Technical oscillators in the prior month pointed toward neutral market conditions. Using historical volatility, the price from the prior month’s close could range between $59.49 and $75.47 ($16.00) in the next 33 days. Investors or traders could consider monthly support ($50.99 to $57.36) or weekly resistance ($69.32 to $72.47) areas when planning their entries or exits based on their trading strategies.
| STATISTICAL VOLATILITY RANGES | STATISTICAL VOLATILITY RANGES | |||
|---|---|---|---|---|
| 21-day | 42-day | 63-day | Monthly (Min) | Monthly (Max) |
| 26.60% | 26.68% | 41.04% | ±5.18 | ±7.99 |
MICRO COINDESK BITCOIN FUTURES
Micro Coindesk Bitcoin Futures (MCB) took a breather following July’s fresh contract highs of $123,032, retreating to end August at $110,352 - a 7.6% decline from the previous month’s close, snapping a streak of five consecutive monthly gains.
With global macroeconomic headwinds intensifying, central banks have begun cutting interest rates. At the same time, spot-bitcoin exchange traded funds (ETFs) experienced outflows, while major holders (“whales”) trimmed their positions. A key event occurred on August 24, when the sale of 24,000 bitcoins triggered a sharp flash crash and, according to some reports, led to roughly $500 million in leveraged liquidations.
Daily technical indicators of MCB prices indicated mostly buying price action for daily and weekly moving averages. The technical oscillators indicated mixed market conditions. Using historical volatility, the price from the prior month’s close could range between $97,775 and $122,930 ($25,154) in the next 33 days. Investors or traders could consider the weekly support ($107,220 to $110,073) or daily resistance ($120,040 to $123,033) areas when planning their entries or exits based on their trading strategies.
| STATISTICAL VOLATILITY RANGES | STATISTICAL VOLATILITY RANGES | |||
|---|---|---|---|---|
| 21-day | 42-day | 63-day | Monthly (Min) | Monthly (Max) |
| 36.14% | 39.48% | 37.75% | ±11513 | ±12577 |
MICRO ASIA TECH 30 INDEX FUTURES
Asia Tech 30 Index (ATI) futures marginally sustained their upward trajectory in August, closing the month at $5,059 - marking a 1.4% gain from July’s close of $4,990.
Taiwanese stocks displayed a strong bifurcation in August. Quanta Computer slipped by 6.70%, while ASE Technology Holding edged down by 1.00%. In contrast, Delta Electronics surged by 25.40%, leading gains in the sector. Hon Hai Precision Industry also performed robustly, climbing 14.30%. Taiwan Semiconductor Manufacturing held steady with no change, and MediaTek likewise remained flat.
Japanese equities produced a mixed but generally positive outcome. FUJIFILM Holdings delivered a solid gain, rising 11.20%. Fujitsu Limited followed suit, advancing 8.20%. Sony Group Corporation climbed 10.90%, and Advantest Corp. Technology posted the strongest gain among Japanese tech players at 12.80%. Murata Manufacturing edged up 7.30%, Keyence Corporation added 2.90%, Lasertec Corp. Technology inched ahead by 0.90%, and Canon Inc. rose 1.20%. Nintendo delivered a moderate gain of 4.90%. On the downside, DISCO Corp. Technology declined 9.20%, and Tokyo Electron tumbled significantly, down 24.40%.
In China, performance was notably mixed with some high volatility. Tencent Holdings gained 8.50%, and Baidu, Inc. also rebounded, advancing 5.70%. NetEase added 3.90%, while Alibaba Group remained unchanged. On the downside, Kuaishou Technology dropped 2.10%, Xiaomi Corp. declined 0.60%, JD.com fell 4.10%, and Meituan plunged 15.50%.
South Korean stocks experienced a general downturn in August. SK Hynix decreased 1.60%, Samsung Electronics declined 2.40%, and LG Energy Solution posted the steepest loss at 8.00%.
Australia’s representation in the ATI registered a sharp decline. Wisetech Global plunged 14.70%, marking one of the weakest performances among all component stocks for the month.
Daily and weekly moving average technical indicators of ATI prices indicated strong buying market conditions during the month. Technical oscillators indicated mixed market conditions last month. Using historical volatility, the price from the prior month’s close could range between $4,710 and $5,408 ($698) in the next 33 days. Investors or traders could consider weekly support ($4,813 to $4,856) or daily resistance ($5,009 to $5,198) areas when planning their entries or exits based on their trading strategies.
Index Composition: 31.9% Taiwan, 26.9% Japan, 26.5% China, 14.2% South Korea, 0.5% Australia
| STATISTICAL VOLATILITY RANGES | STATISTICAL VOLATILITY RANGES | |||
|---|---|---|---|---|
| 21-day | 42-day | 63-day | Monthly (Min) | Monthly (Max) |
| 23.91% | 20.84% | 21.55% | ±304.3 | ±349.2 |
Product highlights
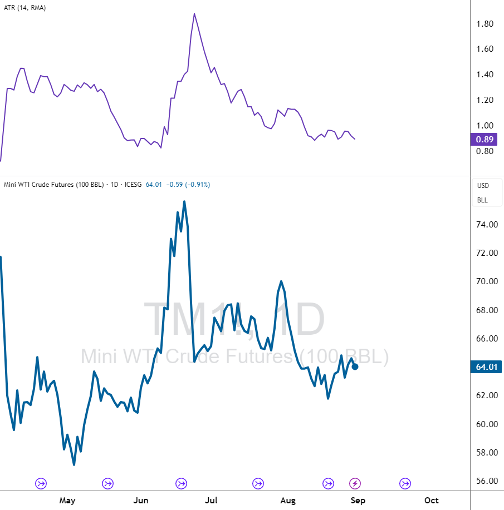
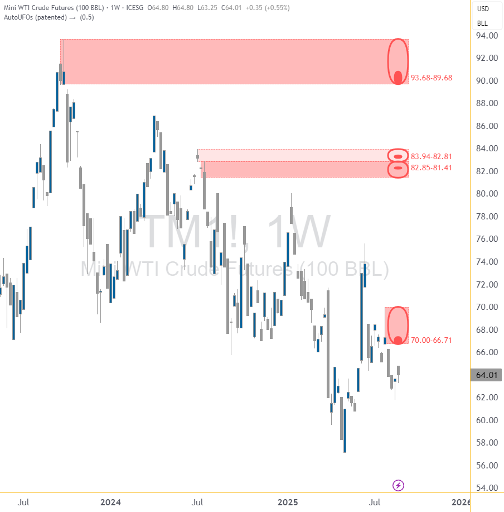
MINI WTI CRUDE FUTURES (100 BBL)
Mini WTI Crude Futures (100 BBL) with a 100 barrels (BBL) contract size is U.S. Dollar cash-settled based on the ICE Futures Europe West Texas Intermediate (WTI) Crude Futures Contract. Clients could leverage this and other energy contracts such as the Mini Brent Crude Futures (100 BBL) or Mini Low Sulphur Gasoil Futures (10 mt) in their trading strategies or hedging. The reduced product size allows clients to optimize their capital exposure allocation and flexibility to utilize financial leverage across multiple products, giving portfolio diversification opportunities to the client.
DAILY INTERVAL
WEEKLY INTERVAL
CONTRACT SPECIFICATIONS
| 21-day | Expirations | Min. Fluctuation | Multiplier Value |
|---|---|---|---|
| TM | All Months | $0.01 | $1.00 |
| Trading Hours | Closed Per Day | Initial Margin* | Daily ATR* |
| 9:00AM-7:00AM SG Time | 2 hours/day | ≈ $680 | 0.89 |
BROKERS
KGI Futures | Orient Futures Singapore | Phillip Nova
*Initial Margin and Daily ATR values are updated as of the date of this publication