
For asset owners, a better way to manage rate volatility
How sophisticated pricing & analytics can inform better risk management and asset allocation choices
Published
November 2023

Patrick Ge, CFA
Fixed Income Specialist, Product Management

Neil Patel
Manager, Analytics Business Development
Amid a U.S. rate hike cycle unprecedented in its pace and magnitude, many asset owners are grappling with how to best manage their portfolios. Since the onset of the pandemic in March 2020 until October 2023, the US Treasury 2-year yield has soared over 2000% to 5.10%. For fixed income investors, this swift and significant rise in rates, coupled with an uncertain interest rate outlook, highlight the importance of interest rate risk management.
Asset owners such as insurers and pension plans, have traditionally held a sizeable portion of their portfolios in fixed income securities. They employ duration-matching to align cash flows of these securities with the projected future obligations to policyholders and pension beneficiaries. This means the rapid rise in yields and uptick in rate volatility has presented valuation and asset-liability matching challenges. Accounting rules, including International Financial Reporting Standard (IFRS) 9 and IFRS 17 which became effective as of 1 January 2023, raises additional questions about how best to classify and measure assets and liabilities. More than ever, access to high-quality pricing and analytics is key to managing these risks.
The chart above shows the ascent of the US Treasury yield curve between the onset of the pandemic in March 2020 and the end of October 2023. The curve has considerably flattened and inversion is evident at the short-end, with the 2-year yield above the 10-year yield. This yield curve behaviour is a bear flattener and has historically been a precursor of an economic recession.
As a data provider, ICE provides evaluation pricing for ~3 million fixed income instruments extending beyond commonly traded sovereign and corporate bonds. Our coverage encompasses more complex instruments such as mortgage-backed securities, which are favored by some insurers given their long-dated nature, allowing for effective matching of long-dated liability cash flows. Given their more complicated structures, pricing these instruments necessitates both market expertise and accurate prepayment risk modelling. ICE’s securitized coverage includes 1 million U.S. agency pass-through issues, 200,000 US agency and non-agency collateralized mortgage obligations, 17,000 asset-backed securities, 11,000 commercial mortgage-backed securities, and 5,000 European and APAC asset and mortgage-backed securities.1
Valuation aside, insurers rely on derived analytics to better estimate and manage future cash flow shortfalls, which has become increasingly difficult with the current interest rate backdrop. One such metric is Key Rate Duration, a comprehensive assessment of a portfolio’s interest rate risk versus duration, which calculates interest rate sensitivity at specific tenors along the yield curve. This provides a granular look into a portfolio’s cash flows in response to non-parallel yield curve movements. At the same time, it can help unearth structural discrepancies between a portfolio and a benchmark or its liabilities, providing valuable insights into term structure sensitivity. Key Rate Duration is one out of 200-plus fields that asset owners can utilize in their analysis, available in several delivery formats, including on our web-platform ICE Portfolio Analytics - Bonds (IPA-Bonds).
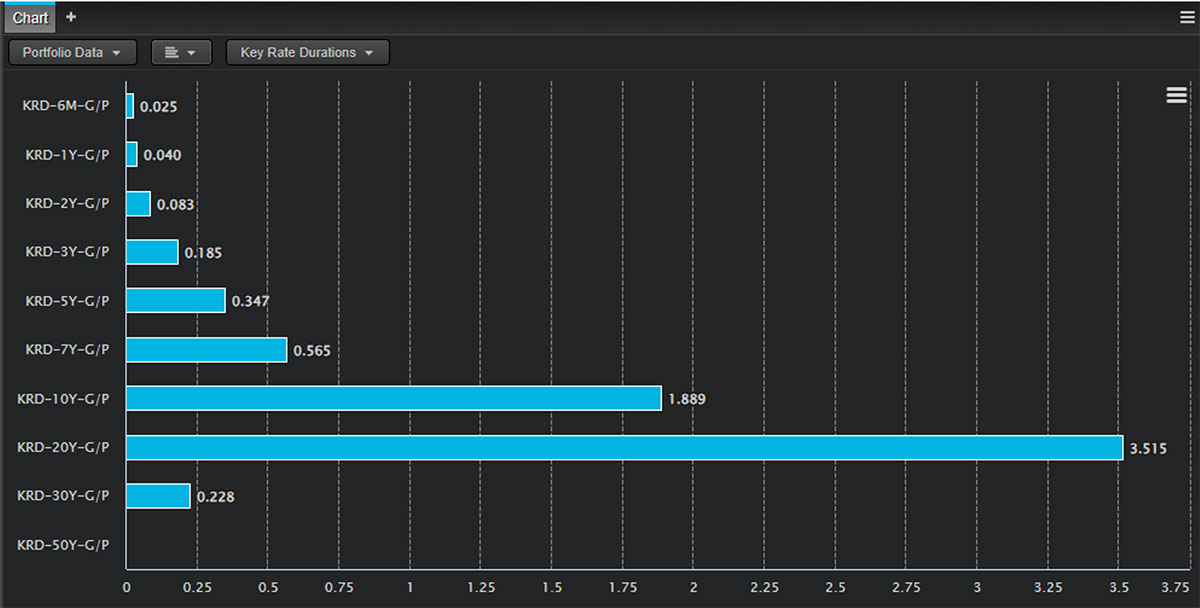
Key Rate Duration analysis from ICE Portfolio Analytics is represented in the graph above, showing the duration distribution for a USD fixed income portfolio across various key rate durations, from 6 months to 30 years. Notably, the graph shows that the 20-year key rate duration contributes significantly to the portfolio’s interest rate sensitivity, accounting for more than half of the portfolio’s overall duration at 3.515 years. This indicates that movements in the mid- to long-term section of the US yield curve will have a greater impact on the portfolio’s valuation compared to the front-end. This insight enables insurers to make informed asset allocation and risk management decisions to align with their investment objectives and liabilities.
ICE, through its IPA-Bonds product, offers an expansive range of capabilities beyond Key Rate Duration analysis, including comprehensive projections of both portfolio and security cash flows across numerous parallel and non-parallel interest rate scenarios. The accompanying chart, generated by the cash flow forecasting in IPA-Bonds, demonstrates how prepayment cash flows would behave under six parallel interest rate shocks for a sample USD-denominated broad market portfolio over a 10-year period.
Prepay cash flows
The graph reveals that as interest rates decline, the timing of prepayment cash flows accelerates, resulting in higher amounts of cash flows occurring earlier in the bond’s lifetime and fewer cash flows occurring later. This pattern emerges due to issuers seeking to refinance their debt and capitalize on the benefits of lower interest rates. However, this relationship weakens over time as the bonds in the portfolio approach maturity or reach their maturity date. The reduced principal balance associated with closer maturity results in diminished interest savings from refinancing and prepayment activities.
Understanding a portfolio’s key rate duration distribution and cash flows projections are just a few of the important metrics for asset owners in navigating the challenges of an unpredictable interest rate environment. To address these challenges, ICE remains committed to providing comprehensive coverage, expertise and tailored solutions that cater to the specific needs of market participants.
1 As of November 2023