Get personalized support
Contact us for any questions about our wealth solutions
October 2024
The energy that powers residential and commercial buildings accounts for roughly 40% of energy consumption and 35% of overall carbon emissions in the United States.1 The federal government has taken notice. In a 2024 report, the U.S. Department of Energy called for a 65% reduction in the emissions of American buildings by 2035. As of 2024, building performance standards (BPS) exist at the state level in California, Colorado, Washington, and Maryland, as well as in dozens of cities scattered across the country. At a more local level, many city and local governments have joined the National Building Performance Standards Coalition and are starting to enact policies aimed at limiting building energy use or emissions.
Of all the local building standards policies enacted to date, New York City’s Local Law 97 has received some of the most widespread media attention. It was passed by the New York City Council in April of 2019 and officially came into effect on January 1, 2024, as one of the most ambitious pieces of building emissions-related legislation enacted by any U.S. city to date. The law requires most New York buildings over 25,000 square feet (some 27,000 buildings across the city2) to meet new greenhouse gas emissions limits or face penalties. Stricter emissions limits on these large buildings will come into effect in 2030.3 Buildings account for more than two-thirds of New York City’s greenhouse gas emissions, so the law represents an important component in the city’s plan to reduce overall building emissions by 40% in 2030 relative to 2005.4 The goal: net zero by 2050.
As the city begins to grapple with enforcing the legislation, both environmental activists and property-owners have voiced critiques.5 Some activists have criticized supposed loopholes, including the option for non-compliant building owners to purchase renewable energy credits (RECs) to offset excess emissions starting in 20266 and the option for non-compliant building owners to pursue a “mediated resolution” with the city. According to activists, the mediated resolution process could essentially allow building owners to avoid fines for up to two years in exchange for the promise of future compliance.7 On the flip side, property owners have voiced concerns over what they perceive to be disproportionate costs to residents who own smaller multi-family properties like co-ops and condominiums, arguing that the law does not do enough to differentiate between these types of buildings and luxury high-rise complexes owned by institutional real estate entities.8 In fact, several local Queens politicians have gone as far as introducing counter legislation that aims to ease some of the cost impacts on condominium and co-op owners.9
The controversy over Local Law 97 highlights the importance of mapping and understanding the law’s potential impacts at a granular level. Renters, condominium and building owners, taxpayers, and real estate investors alike are all likely to be affected by efforts to reduce building emissions, with average penalties and carbon mitigation costs varying by building age, building type, and neighborhood. Because older buildings may tend to be less energy efficient, these kinds of disparate impacts are not likely to be unique to Local Law 97. Depending on the specific characteristics of their buildings, owners are likely to experience varying degrees of impact from any sort of regulation, ordinance, or federal incentive program aimed at reducing building emissions.
To illuminate the potential costs and impacts of carbon mitigation efforts in the building sector, ICE Climate has developed energy usage and emissions estimates for more than 150 million individual residential and commercial properties across the country. (For details on our methodology, please see the end of this article, as well as a related series.) We demonstrate below how these estimates can be used to look at compliance patterns with Local Law 97 across New York City buildings, as well as the potential costs that building owners may face at the borough, neighborhood, block, and individual building level. We then extend a hypothetical “federal” version of Local Law 97 to large buildings (those greater than 25,000 square feet) across the country to understand the potential impacts of larger-scale carbon mitigation efforts in the future.
Local Law 97’s efficiency standards are based on emissions intensity limits (emissions/square feet) that vary by building type. For example, under the law’s 2024 limits, multi-family housing buildings are allowed higher intensity limits than non-refrigerated warehouses. Specifically, to be in compliance with the law in 2024, multi-family buildings must not exceed 0.00675 metric tons of CO2/square foot (tCO2/sq.ft) while non-refrigerated warehouses must not exceed 0.00426 metric tCO2/sq.ft. The law also defines a ‘grid emissions factor’—the amount of CO2 equivalent10 generated per kilowatt-hour of electricity—to be used for calculating the emissions from electricity usage (often called Scope 2 emissions). In 2030, both the building emissions intensity limits and the law’s assumed grid emissions factor will decrease. The decrease in the grid emissions factor is based on the assumption that New York’s grid will become significantly “greener" over the next six years.
According to ICE Climate’s energy usage and emissions estimates, approximately 10% of New York City’s large (> 25,000 square feet) buildings are estimated to be out of compliance with the 2024 emissions intensity limits set by Local Law 97. These limits last until 2029. In absolute terms, non-compliant buildings for the 2024-2029 time period account for about 2,650 of the 25,800 large New York buildings that exist in ICE Property Data Records.
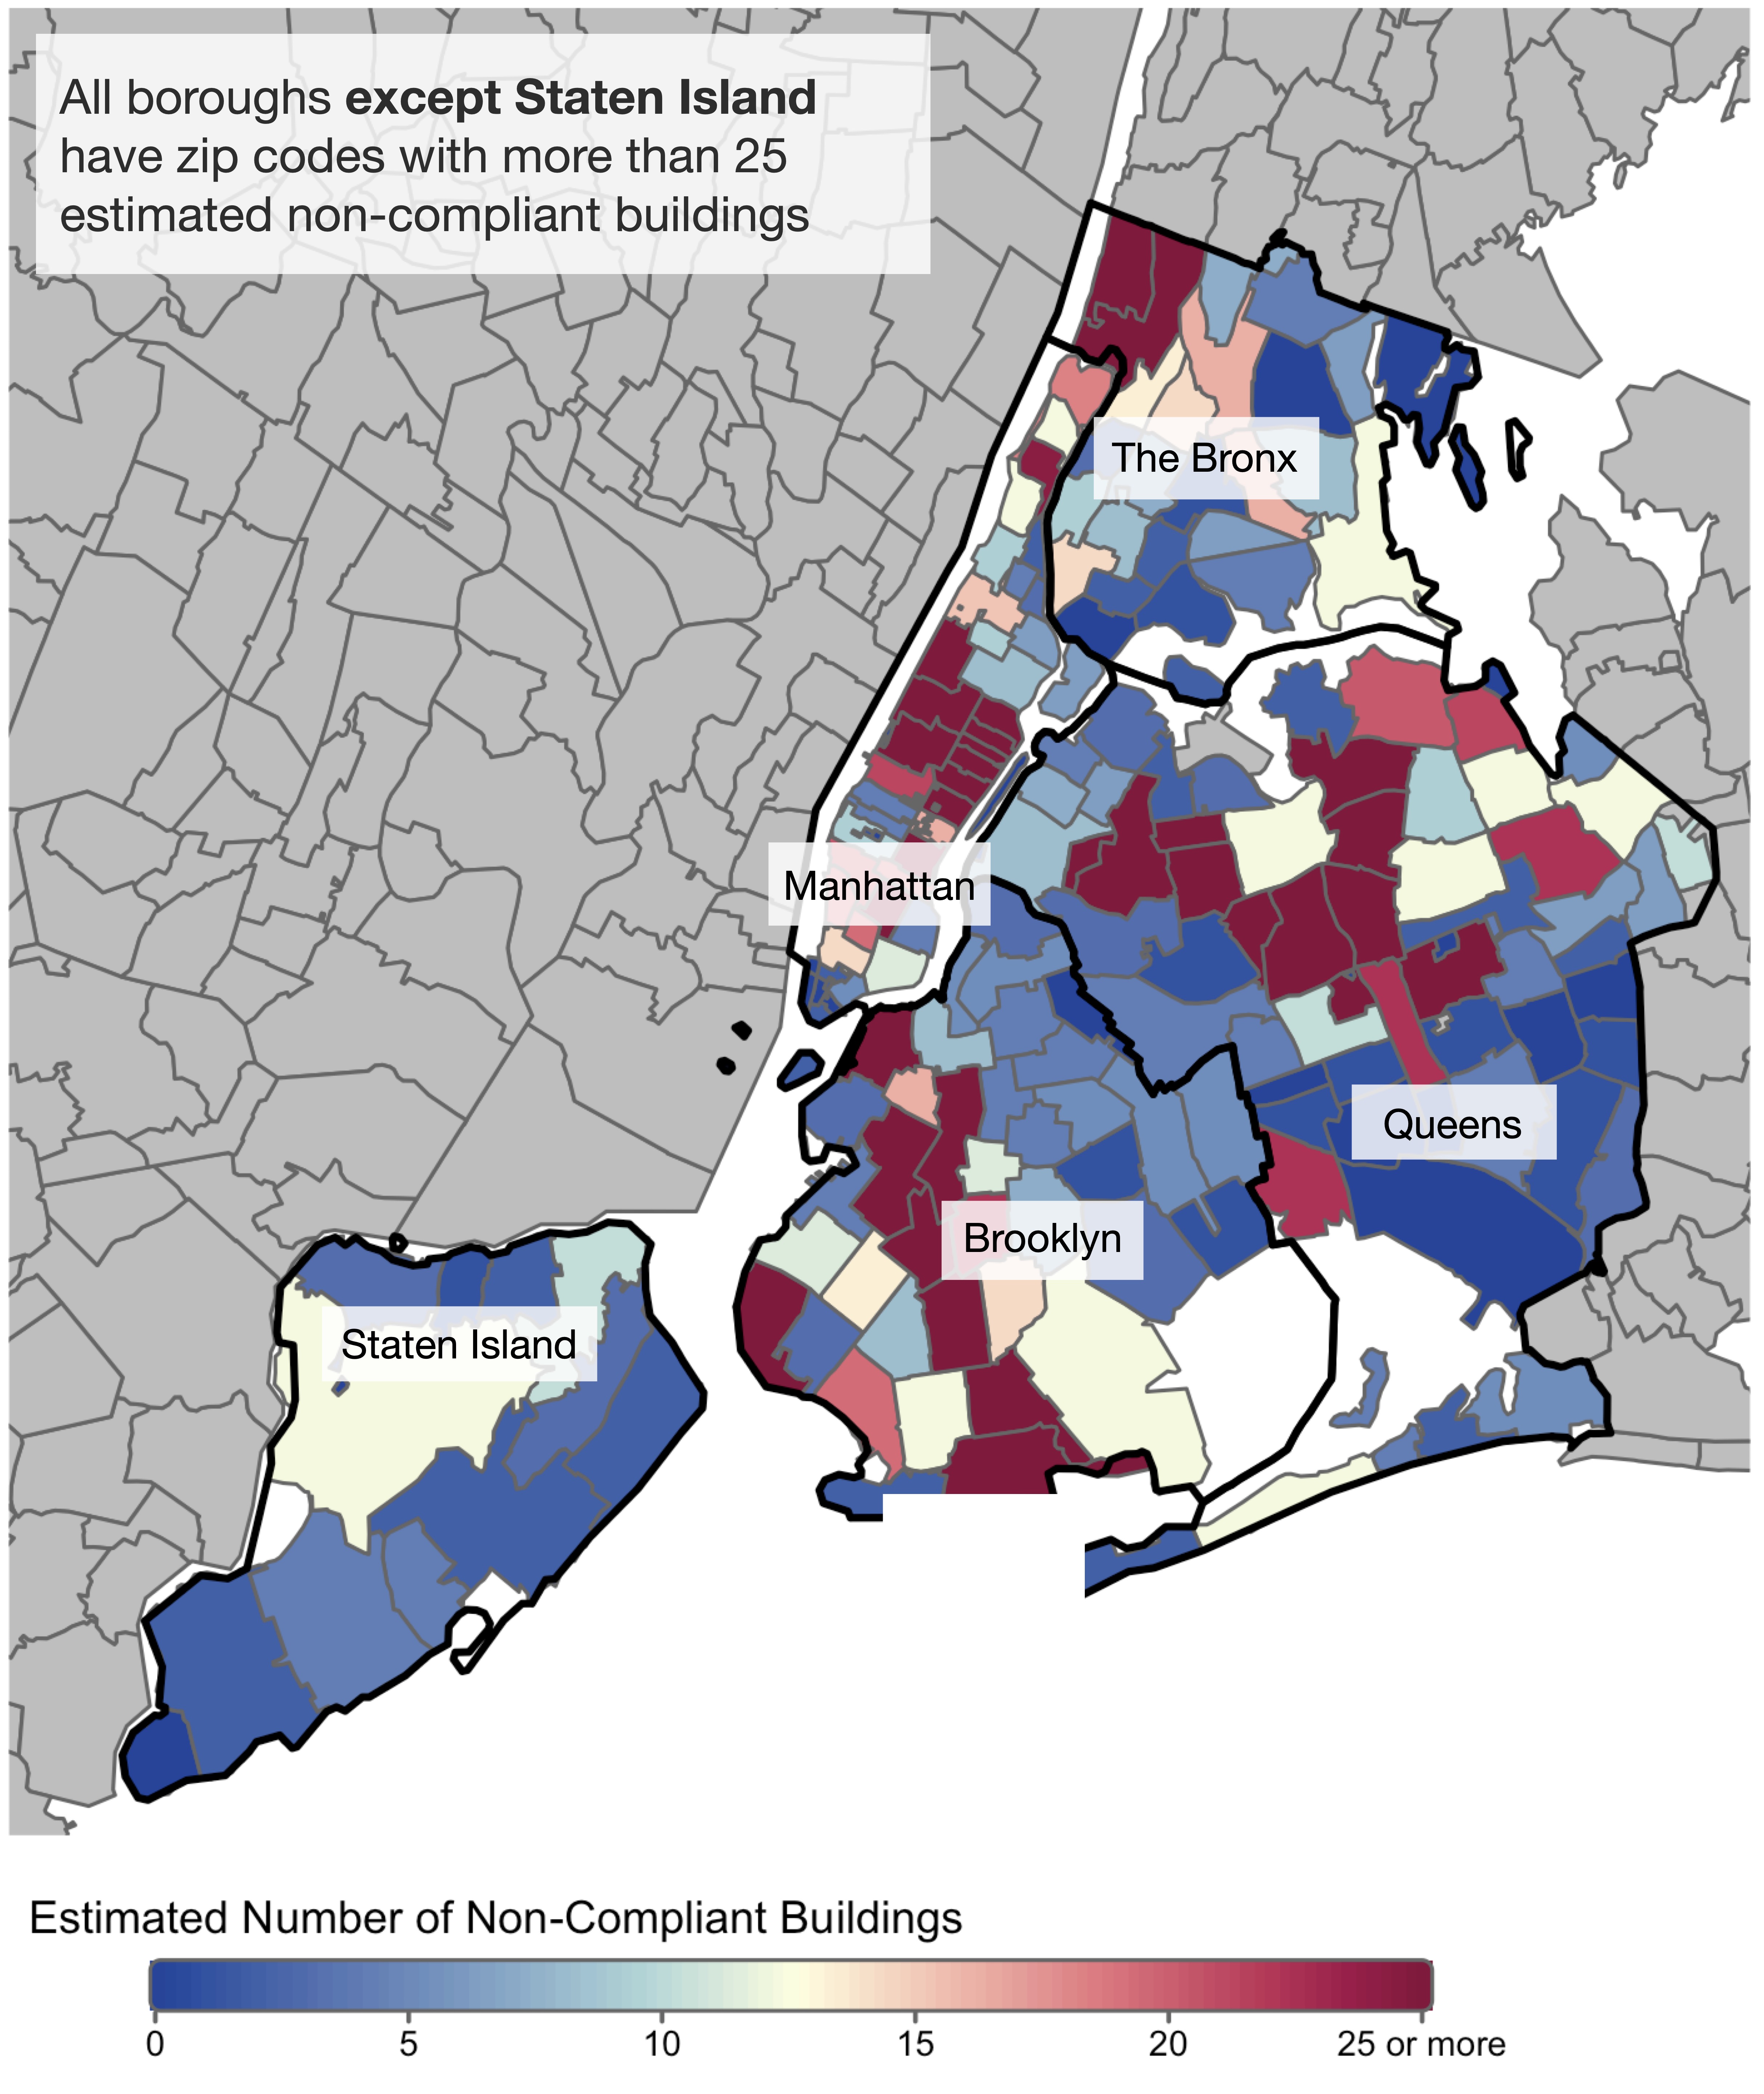
Figure 1. Numbers of large total (greater than 25,000 square feet) non-compliant buildings estimated by zip code across New York City. Source: ICE Climate as of 06/28/2024.
As Figure 1 shows, every borough except Staten Island has multiple zip codes that are estimated to contain 25 or more non-compliant buildings. However, Staten Island also has fewer large buildings in total than the other boroughs. Many zip codes, especially in Queens and Midtown Manhattan, have both high numbers of non-compliant buildings (more than 25) and high percentages of these buildings (more than 20%; Figures 1,2).
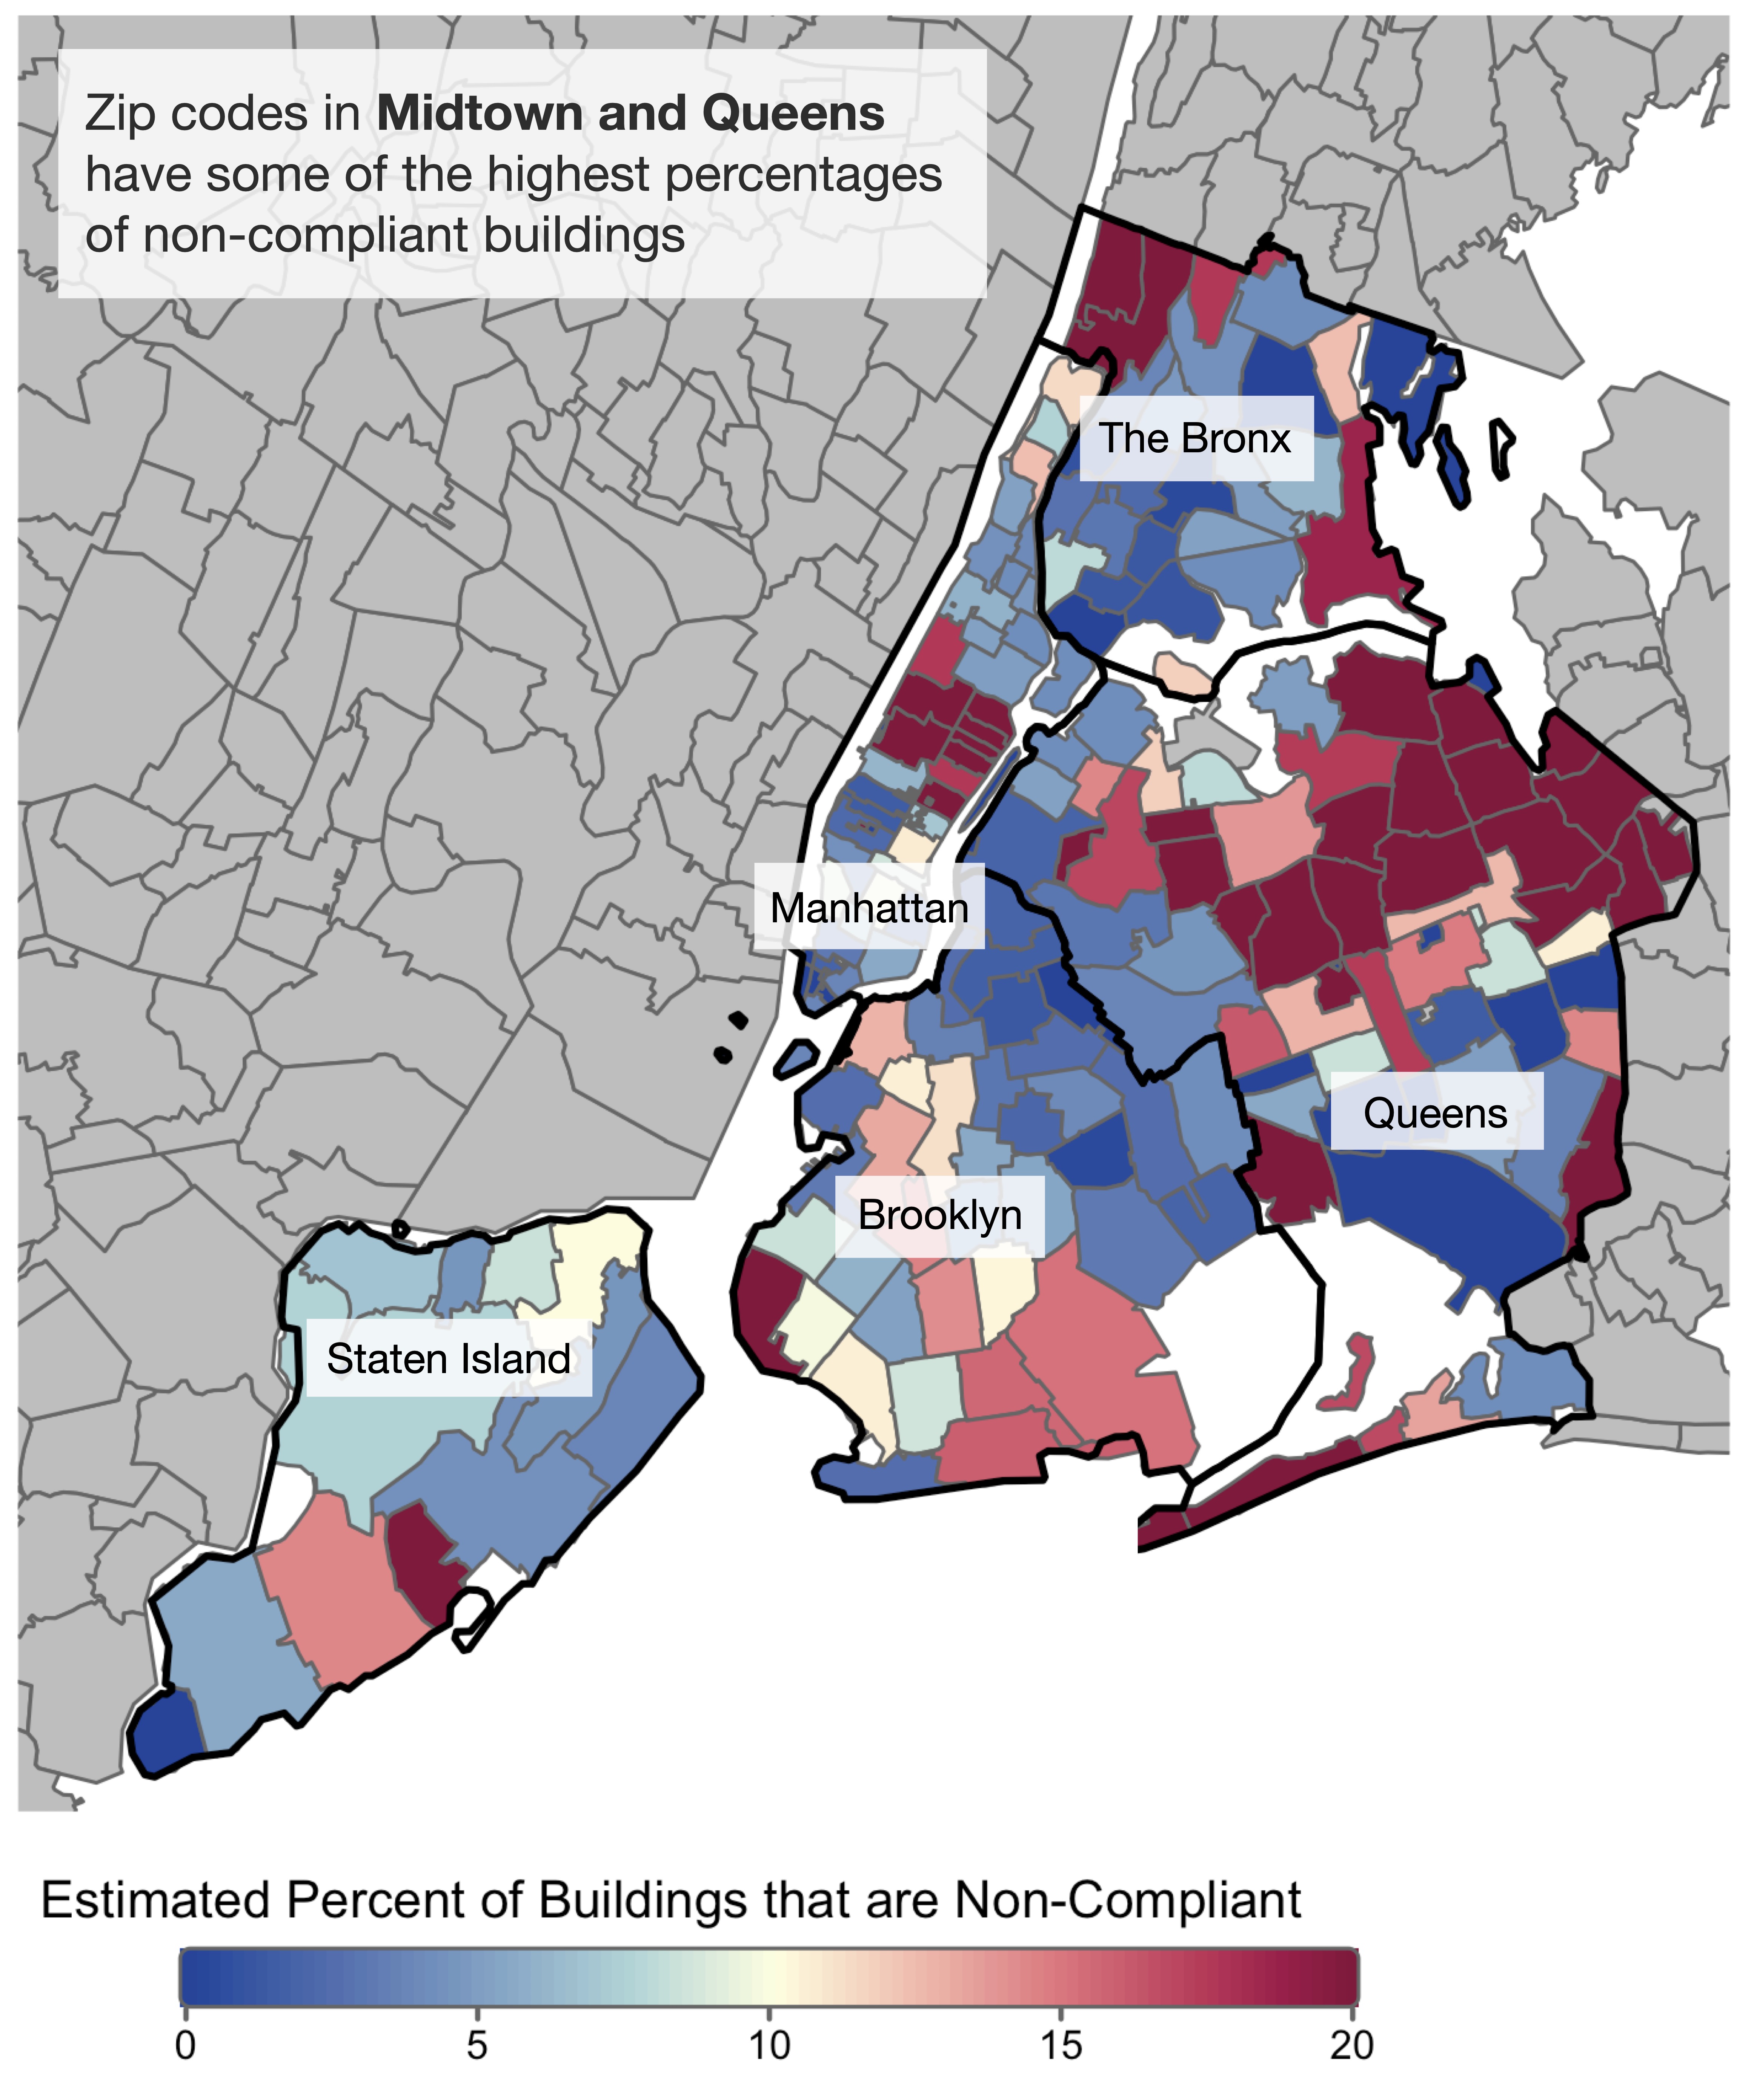
Figure 2. Estimated non-compliance rates by zip code for large buildings (> 25,000 sqft) across New York City. Source: ICE Climate as of 06/28/2024.
As stated above, Local Law 97 has a complex set of coverage exemptions, including certain kinds of exemptions for large city-owned buildings, rent regulated accommodations, and buildings owned by the New York City Housing Authority.11 To get a broad sense of compliance patterns, we examine the estimated number and percentage of non-compliant large buildings (>25,000 square feet), including those that may be exempt from certain parts of the law, in New York City (Figure 1, 2). For penalty estimates, we remove those largely exempt building categories12, including houses of worship, libraries, museums, post offices, courthouses, and K-12 Schools.13
Unsurprisingly, the largest number of non-compliant buildings are in Manhattan (about 950 non-compliant buildings in total; Figure 1.) However, Queens has the largest percentage of these properties (19%). Queens also has the highest estimated average fines for non-compliant buildings (about $142,000) and the highest total penalty ($114 million) estimated for property owners across the borough (Figure 3). This is due to the number of non-compliant buildings and the degree of non-compliance. Buildings in other boroughs have significantly better levels of compliance with Local Law 97’s 2024 requirements.
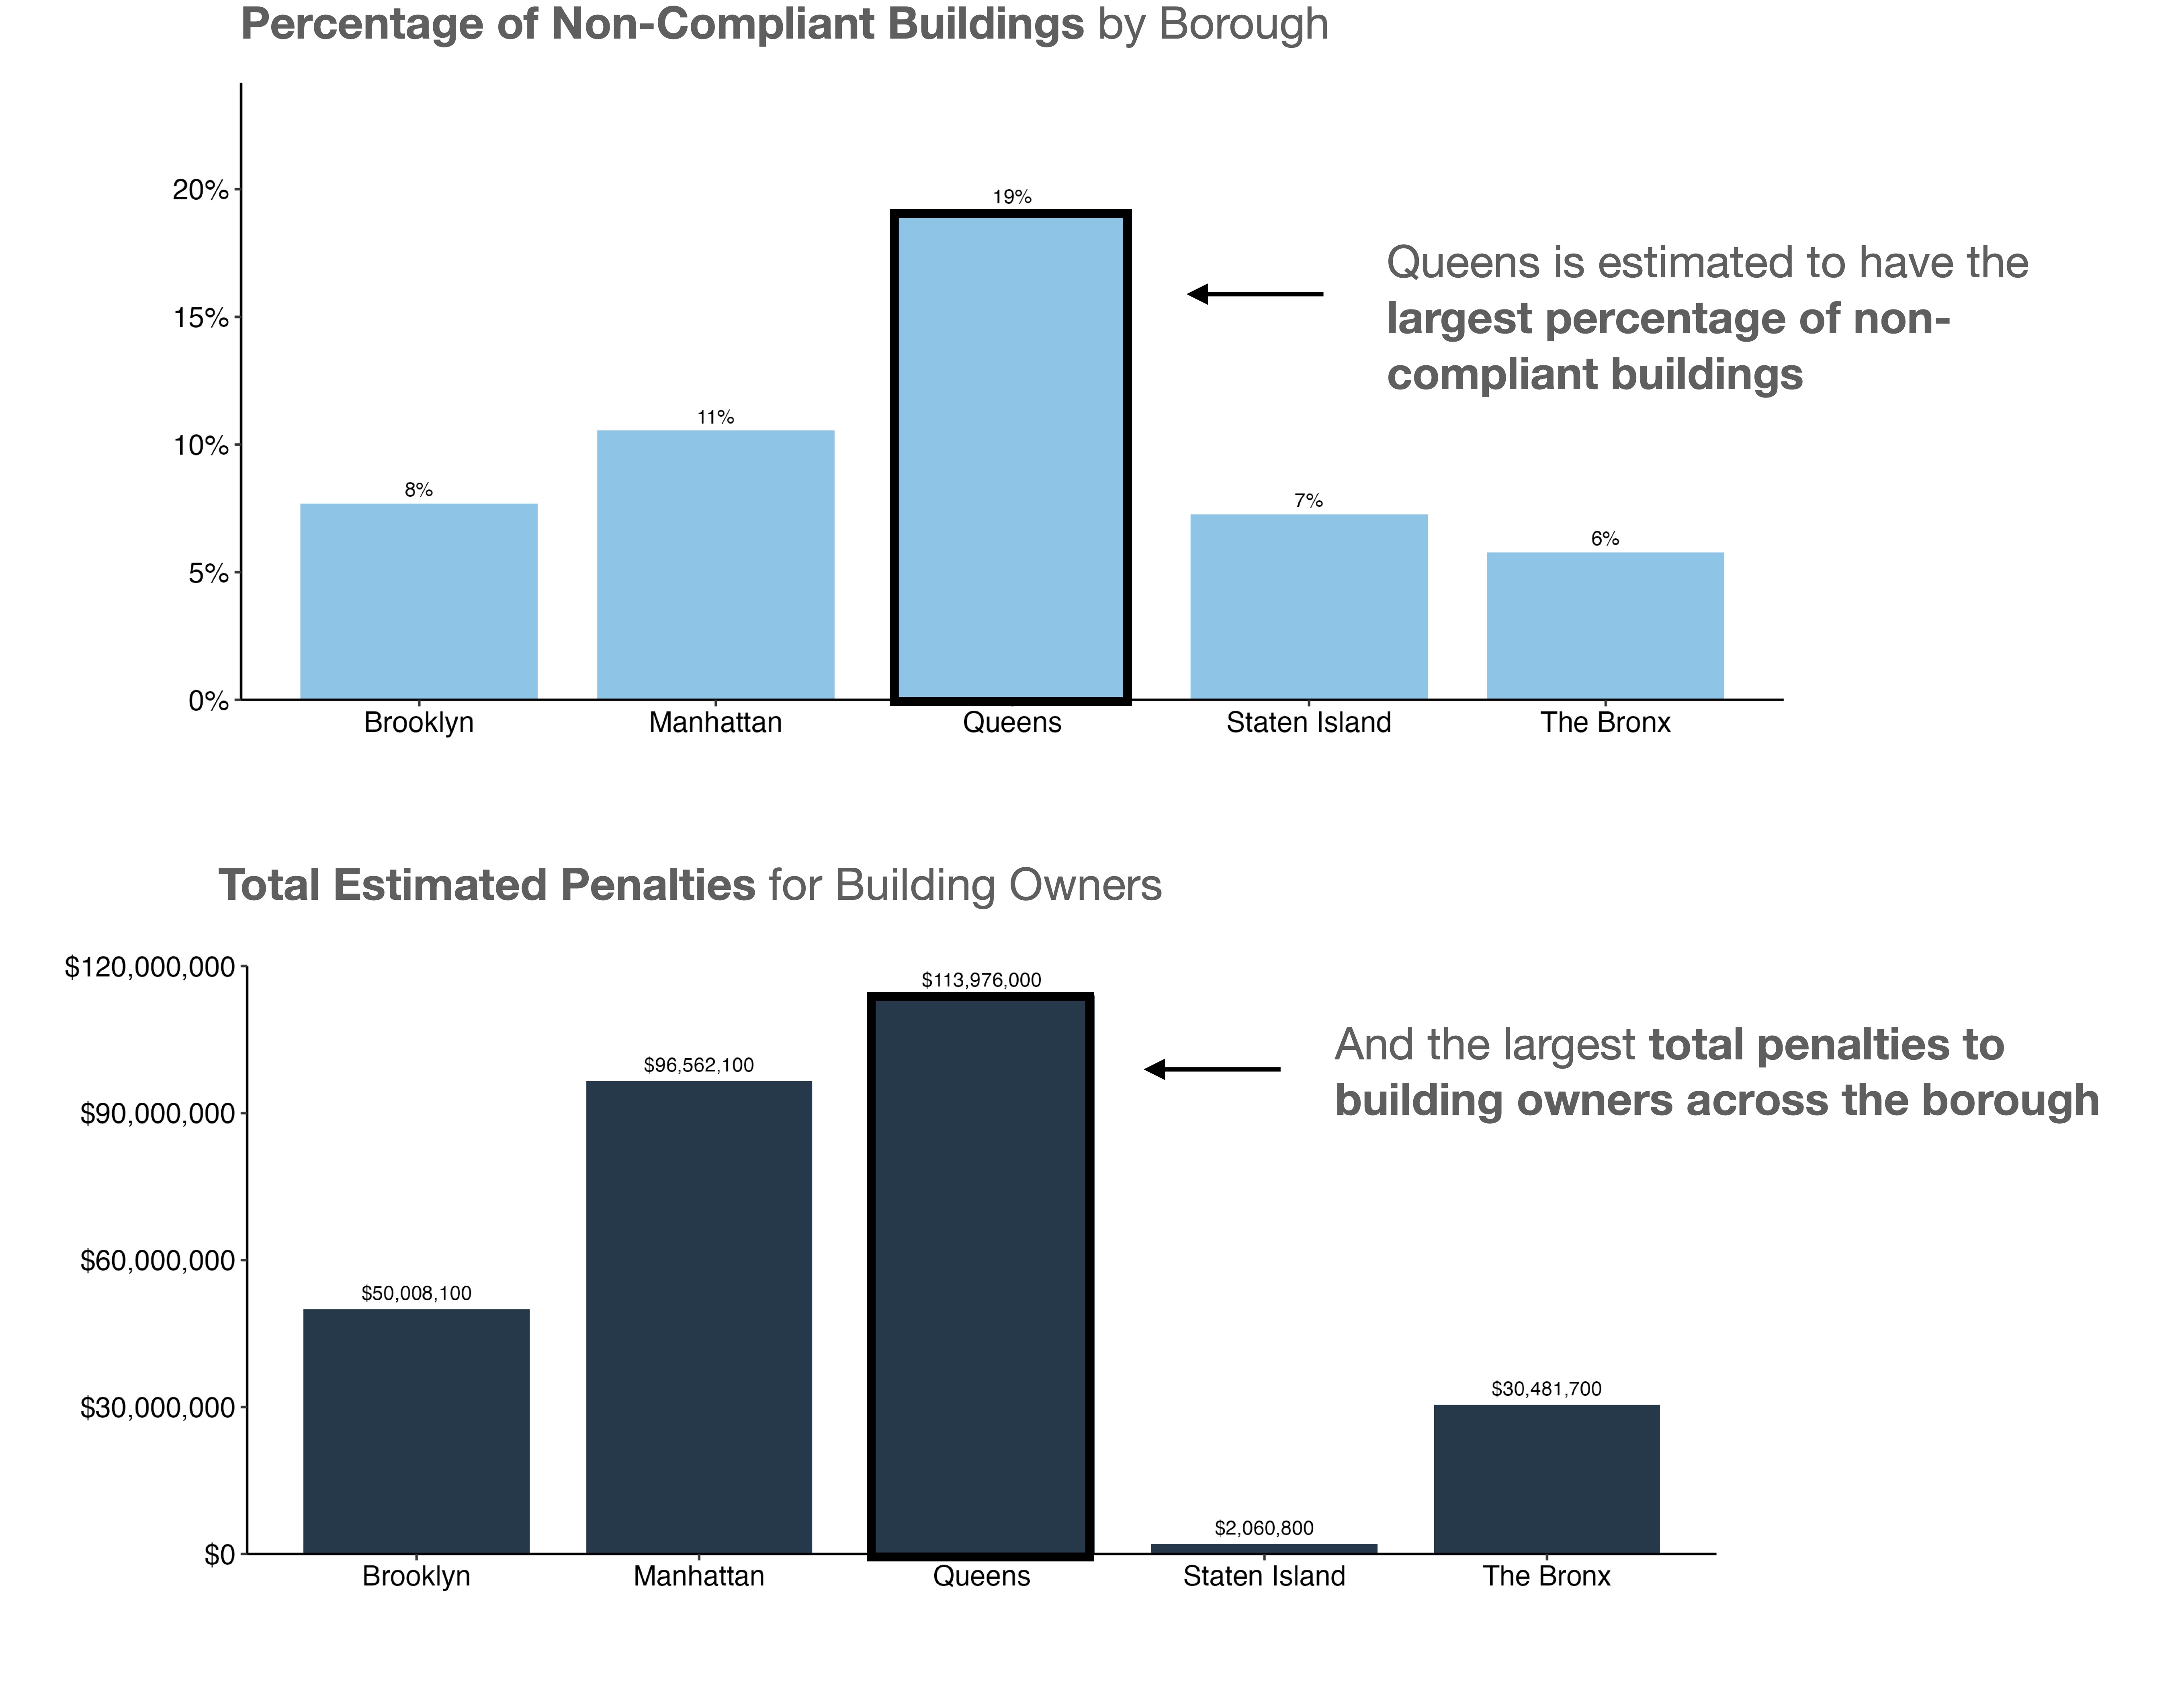
Figure 3. Non-compliance rates and total penalty estimates for large (> 25,000 square feet) buildings by borough across New York City. Source: ICE Climate as of 06/28/2024.
In ICE Climate’s data set, the large buildings (>25,000 square feet) that are estimated to be non-compliant in New York City are overwhelmingly residential (Figure 4). Residential buildings, including multi-family properties, large condominiums, senior housing, and cooperatives (designated as either “Multi-family” or “Other lodging/residential” according to the EnergyStar Portfolio Manager Property Type definitions14) together account for about 2,350 of the 2,650 non-compliant buildings. Together these residential building types are the most common large building category in the city overall. About 17% of multi-family housing properties and 8% of other lodging and residential buildings are estimated to be non-compliant with Local Law 97’s 2024 limits. Compared to other common building types (categories with over 500 large buildings across the city), ICE estimates that non-compliant multi-family housing buildings may also face the highest fines (about $126,400 on average).15
For other buildings categories with more than 500 large buildings in New York City—including retail stores, non-refrigerated warehouses, and financial offices—non-compliance rates are significantly lower (under 2%; Figure 4).
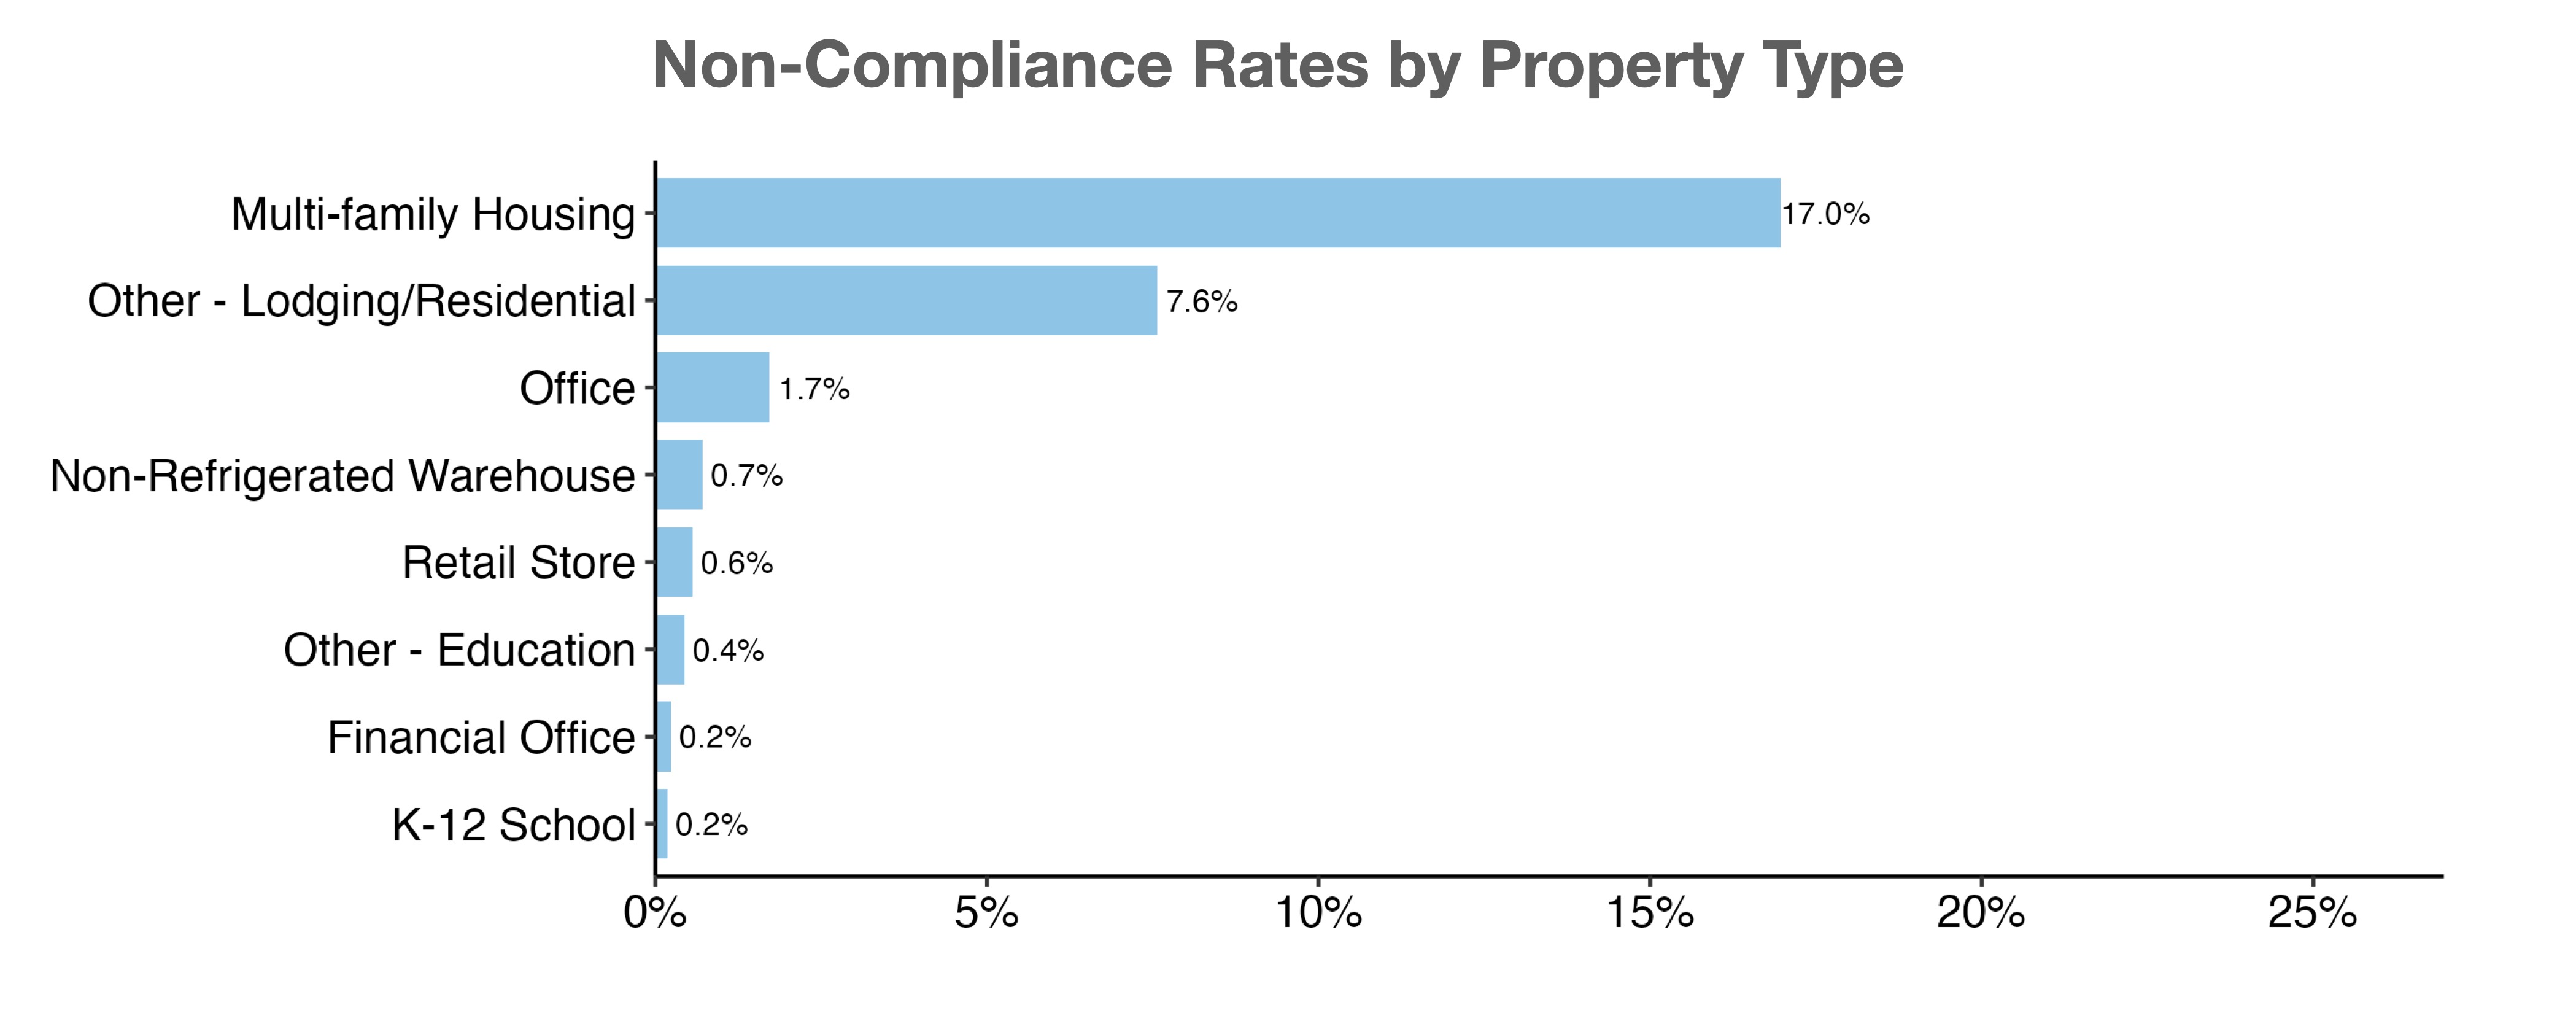
Figure 4. Estimated non-compliance rates for building categories with more than 500 large (> 25,000 square feet) buildings across New York City. Source: ICE Climate as of 06/28/2024.
Compliance levels also vary with building age. Buildings built after 1980 and before 1930 tend to have the lowest estimated non-compliance rates with Local Law 97, while properties that were built in the mid-century (1940s-1960s) tend to have the highest estimated non-compliance rates (Figure 5).
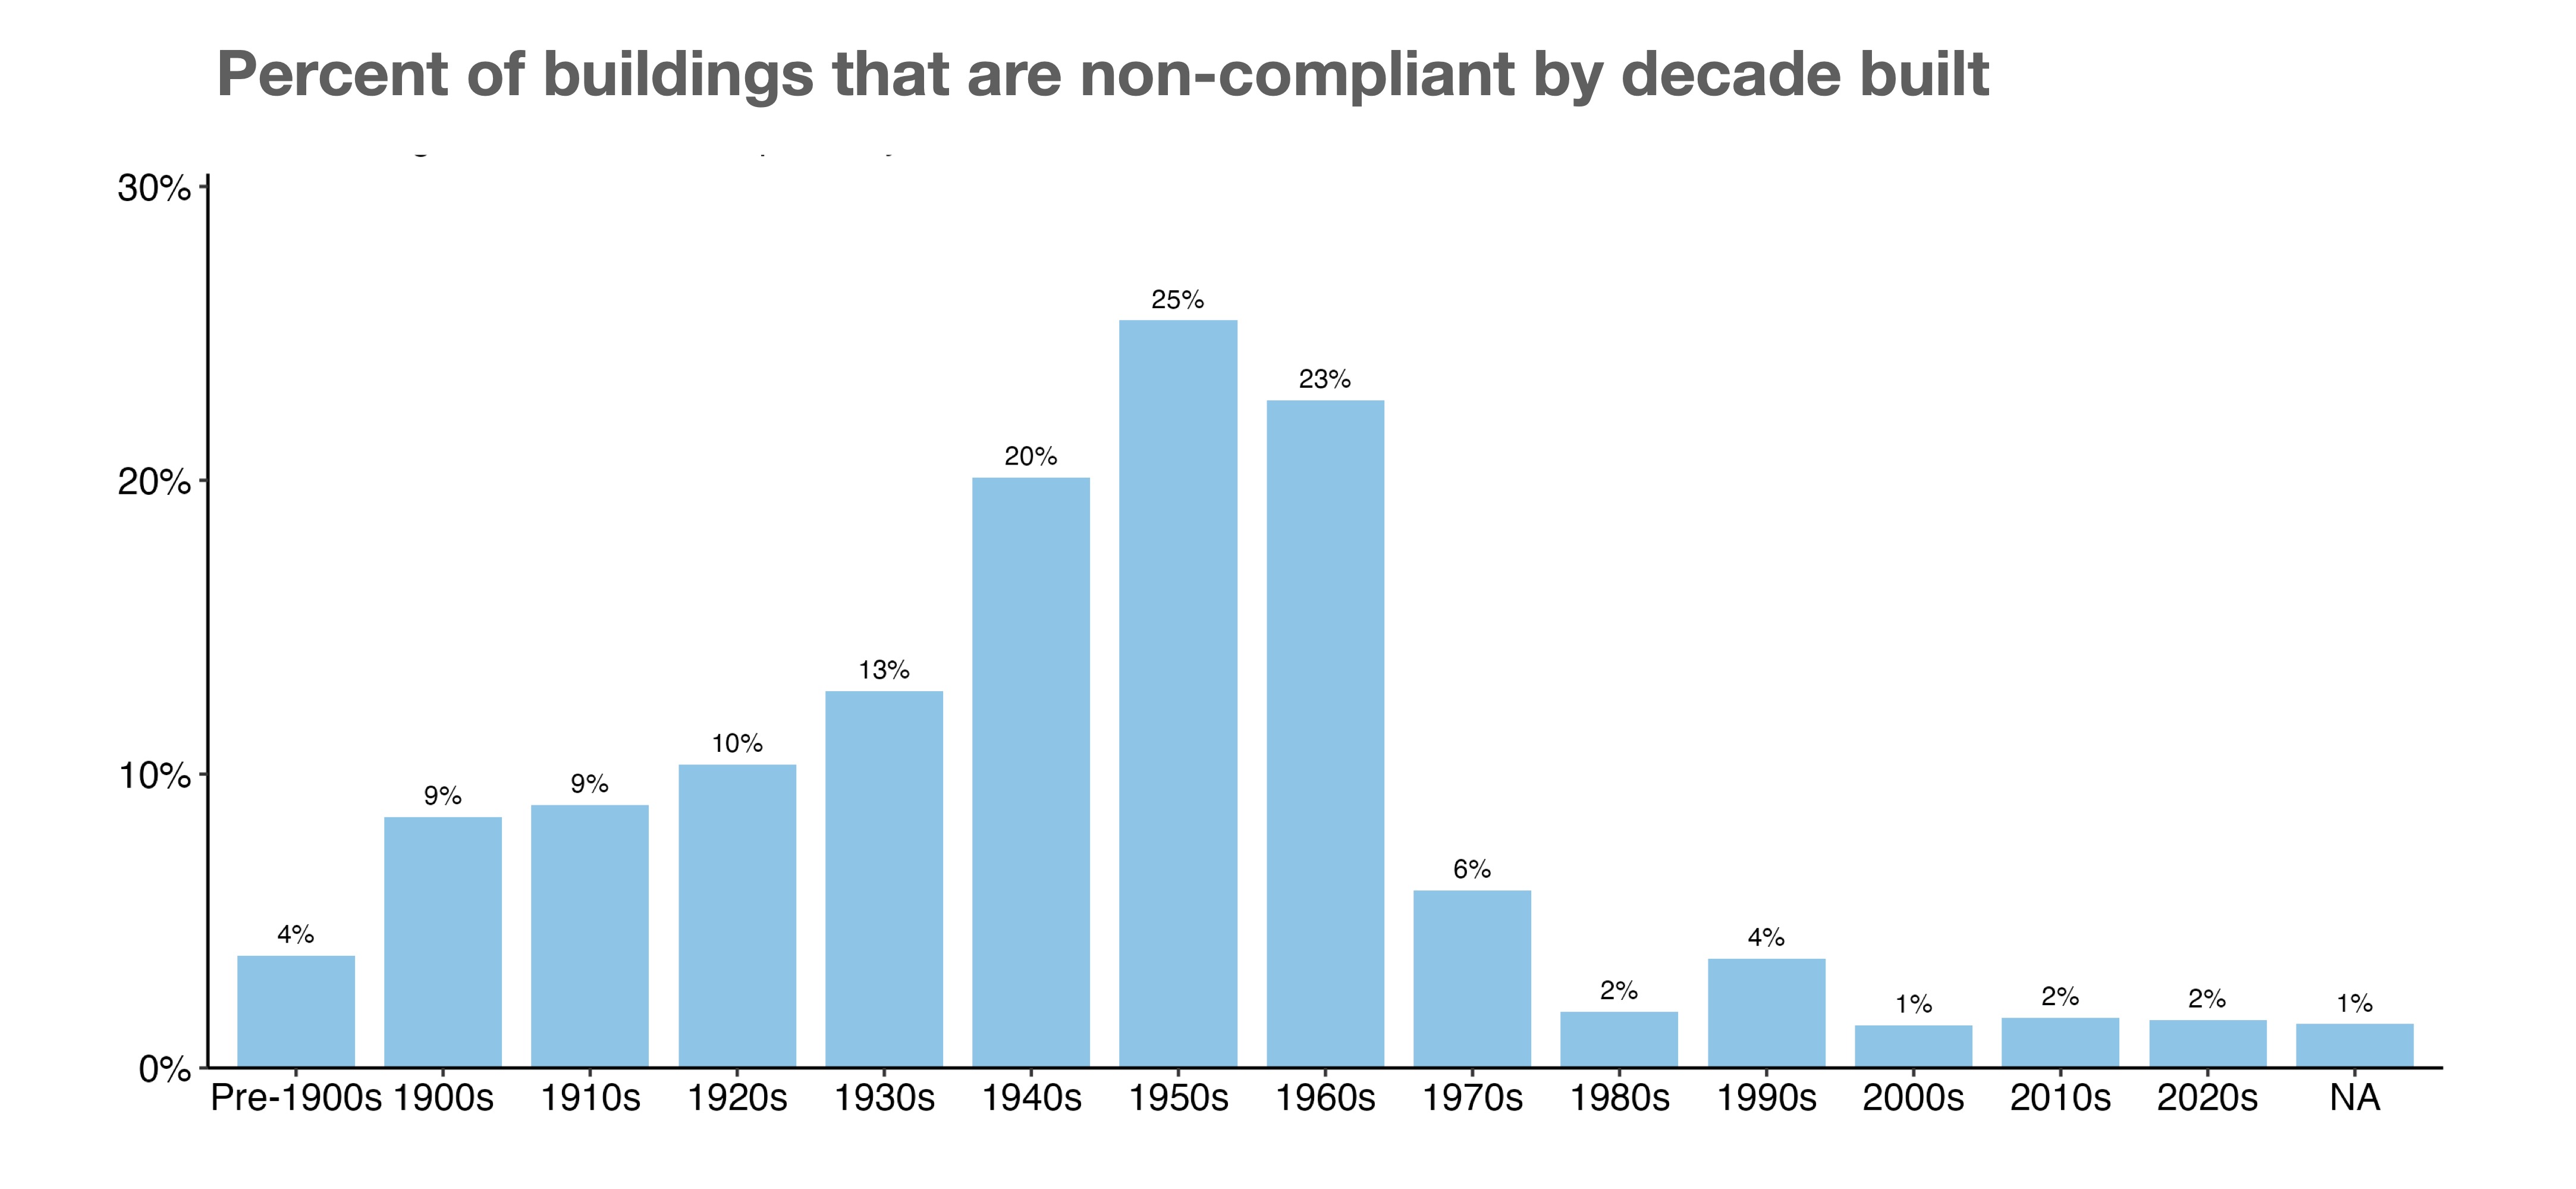
Figure 5. Estimated non-compliance under 2024 limits by decade built for large buildings (> 25,000 square feet) across New York City. (About 1,000 buildings do not have data on year built; 1% of these ‘unknown-year’ buildings are non-compliant.) Source: ICE Climate as of 06/28/2024.
There are also distinct differences between the average square footage of buildings estimated to be compliant and non-compliant (Figure 6). Across all non-compliant large buildings in the city, only about 26% are estimated to be between 25,000 and 50,000 square feet; the rest are larger. A much larger proportion of compliant buildings (about 41%) fall with this lower size range.
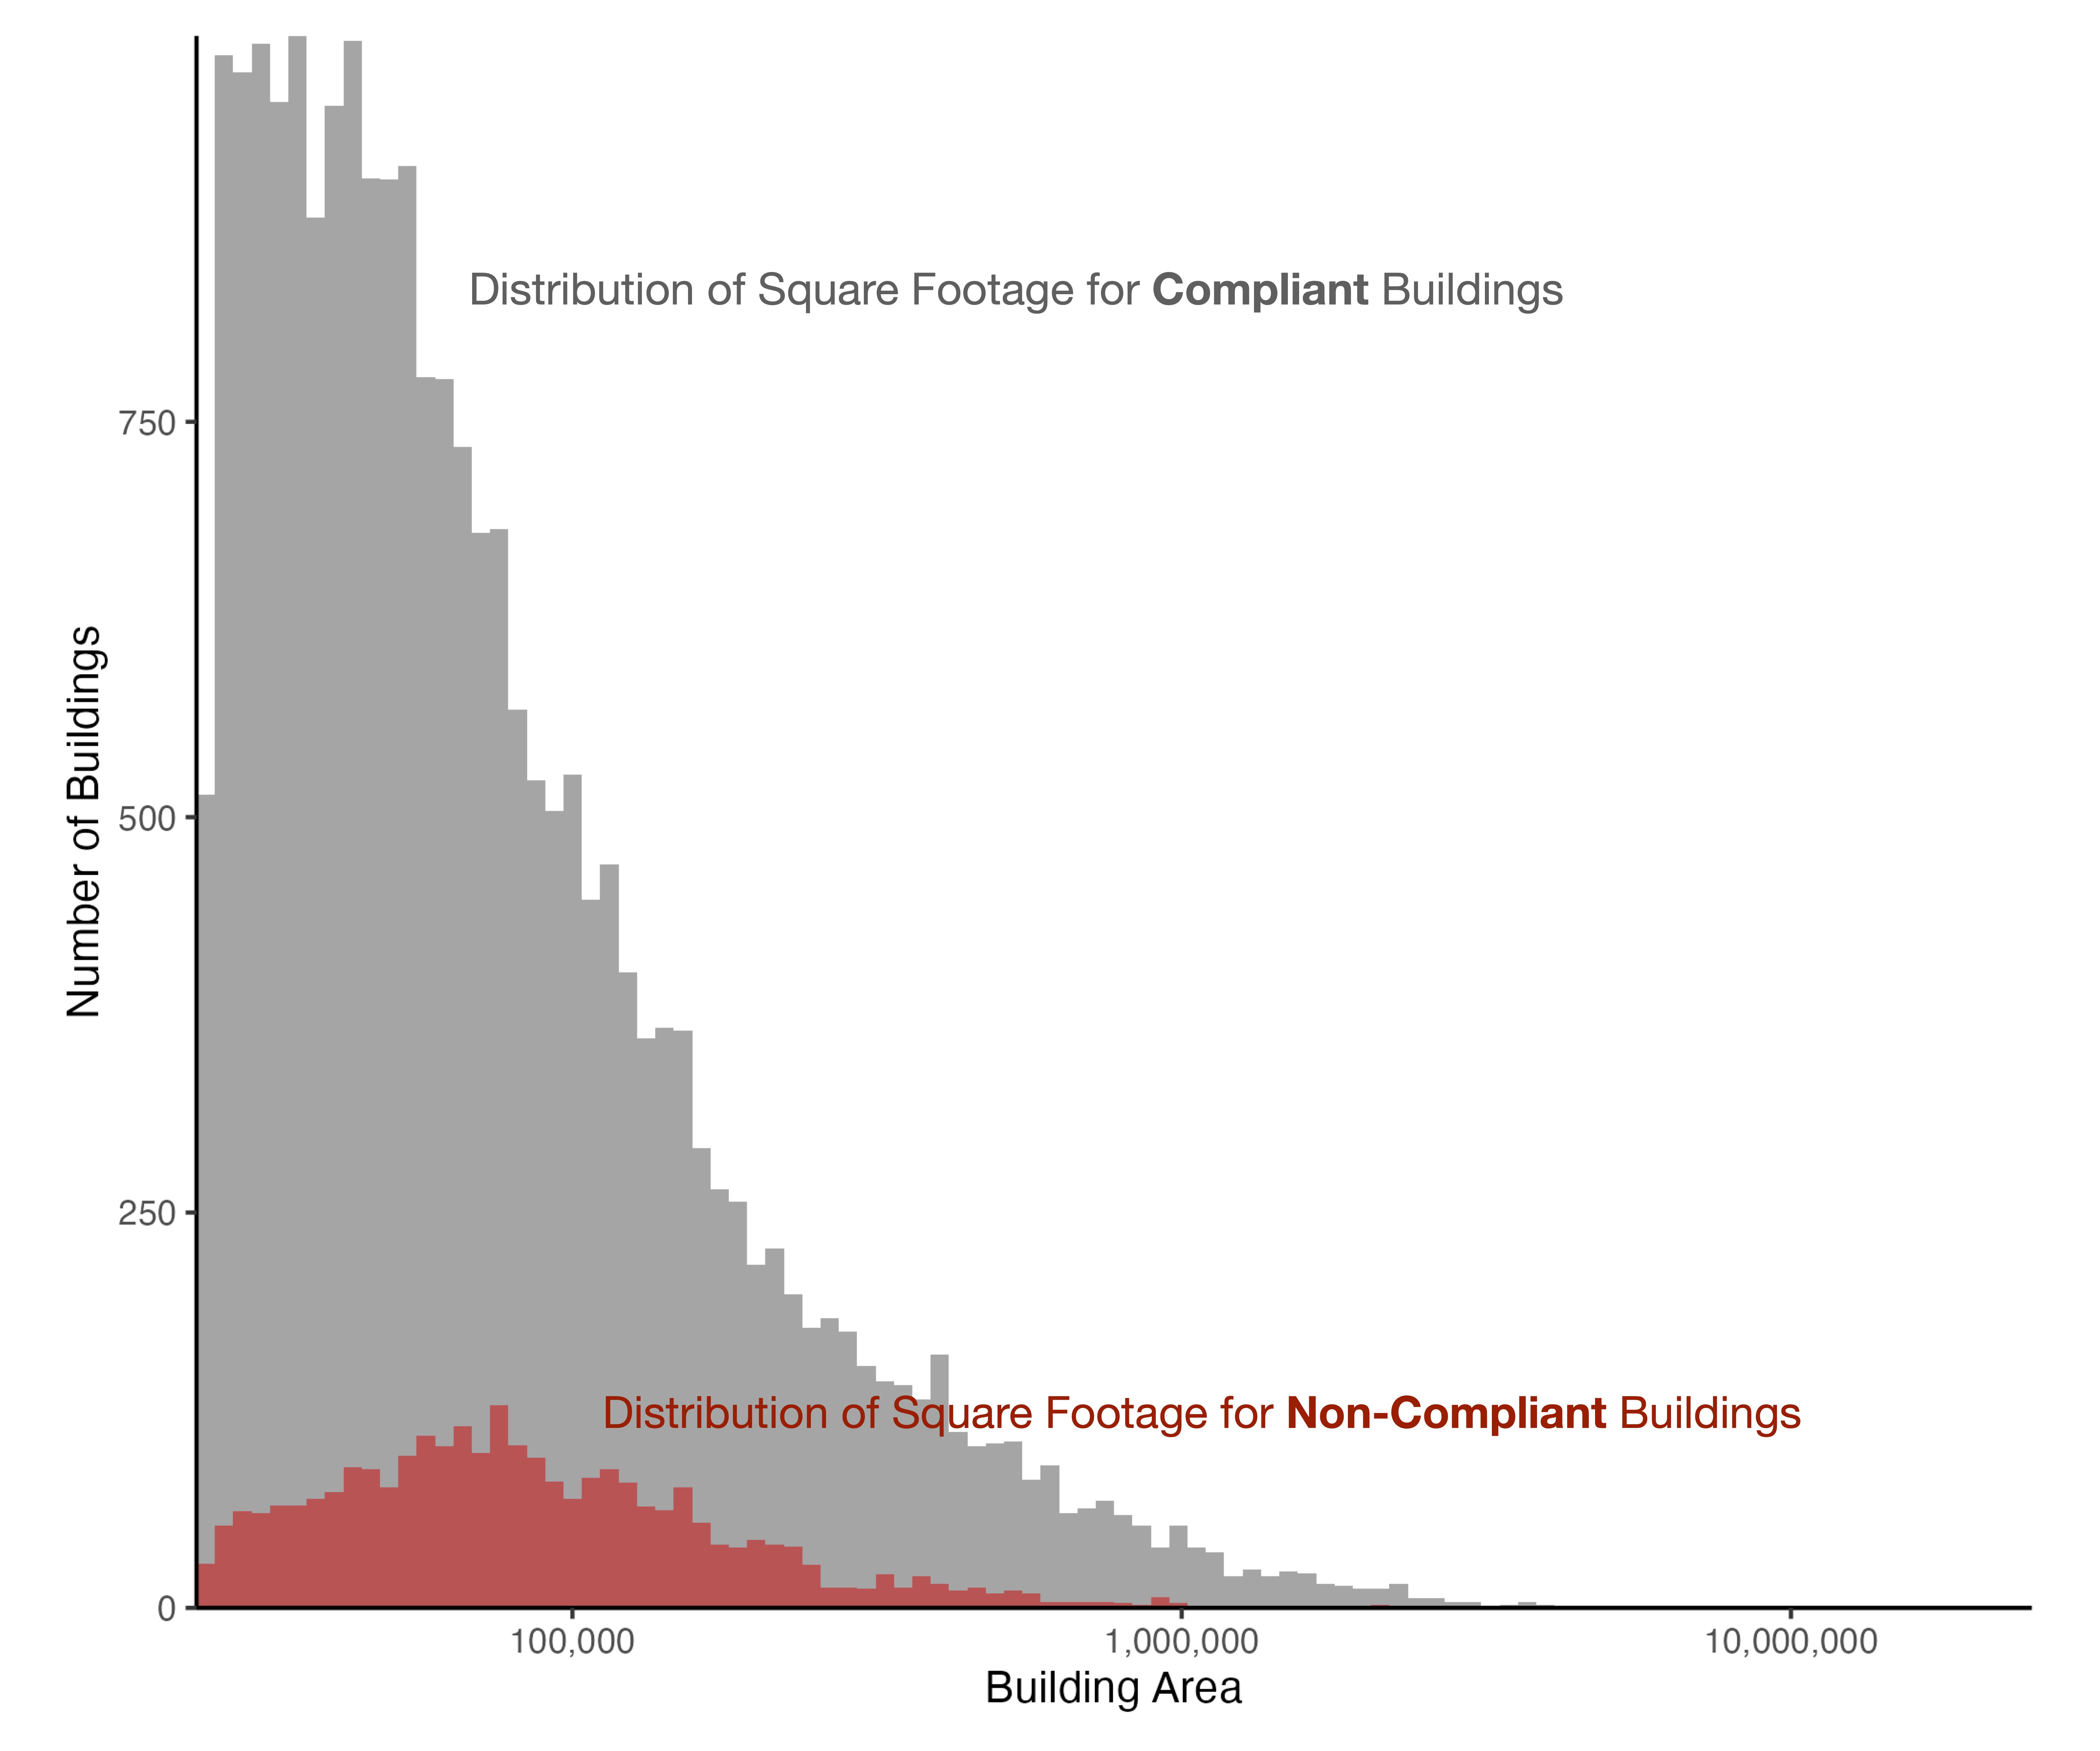
Figure 6. Distribution of square footage for large (> 25,000 square feet) buildings estimated to be compliant and non-compliant across New York City. Source: ICE Climate as of 06/28/2024.
To understand the potential scope of the impacts of Local Law 97, we can examine estimates of the total emissions reductions if non-compliant large buildings in New York City were to come into compliance with 2024 limits. The total estimated emissions produced by large buildings in New York City is approximately 14.8 million tons of CO2-equivalent per year. Based on this total, if all non-compliant large buildings were to come into compliance with the 2024 Local Law 97 limits tomorrow, the city’s annual emissions from large buildings alone would decrease by about 8% (1.1 million metric tons). This decrease would amount to about 0.02% of the United States’ total emissions footprint. For reference, the U.S. Environmental Protection Agency estimates that the total annual emissions footprint of the United States is about 6,300 million metric tons of CO2-equivalent.16
Local Law 97 assumes that the New York electrical grid will become about twice as efficient—producing the same amount of energy with roughly half the emissions—between 2024 and 2030. Under the law, the grid emissions factor will decrease from 0.000288962 to 0.000145 metric tCO2/kwh. Under this assumption, even if all large (>25,000 square feet) buildings in the city did nothing to actively reduce their emissions, the total Scope 2 emissions from these buildings in 2030 would be about 50% of what they are in 2024. However, with no efforts to reduce energy usage or efficiency, emissions generated by on-site heating fuels like propane, natural gas, and fuel oil (Scope 1 emissions) would likely not decrease.
Starting in 2030, large buildings will also face stricter emissions intensity limits under Local Law 97. As discussed above, about 2,650 large buildings are estimated to be out of compliance under 2024 limits, which last from 2024-2029. Looking forward, if large buildings do nothing to actively decrease energy usage over the next six years, the estimated number that are non-compliant under the 2030 limits17 will be over 17,000—more than 65% of large buildings across the city (Figure 7). This estimate accounts for the increased electricity grid efficiency assumed under Local Law 97 by 2030. If all these potential future non-compliant buildings do manage to come into compliance with 2030 limits by 2030, these efforts would reduce building emissions across New York City by about 3 million metric tCO2-equivalent—about 20% of the 14.8 million metric tCO2 footprint of large buildings in the city today and 0.04% of the total current American emissions footprint.

Figure 7. Percent of large (> 25,000 square feet) buildings that are estimated to be non-compliant with 2030 building intensity limits (assuming 2030 Local Law 97 grid emissions factors). Source: ICE Climate as of 06/28/2024.
While every bit counts, these reductions to the overall American emissions footprint are modest in the context of Federal government’s broader goal of reducing emissions to 50-52% of 2005 levels by 2030.18 New York City is the largest city in the country, but it is also only one city. To meaningfully reduce the country’s emissions footprint, laws like Local Law 97 will likely have to be enacted at larger scales.
Using our nationwide ICE Data Property Records and building energy usage and emissions estimates, we can examine the levels of compliance with a hypothetical national version of Local Law 97. For these nationwide emissions estimates for large buildings across the country, we used emissions factors—estimates of the amount of metric tCO2 generated per kilowatt-hour of electricity generation—provided by a company called Singularity. These factors vary across the country, depending on the fuel mixes that are used by different balance authorities to power regional electricity grids (Figure 8).
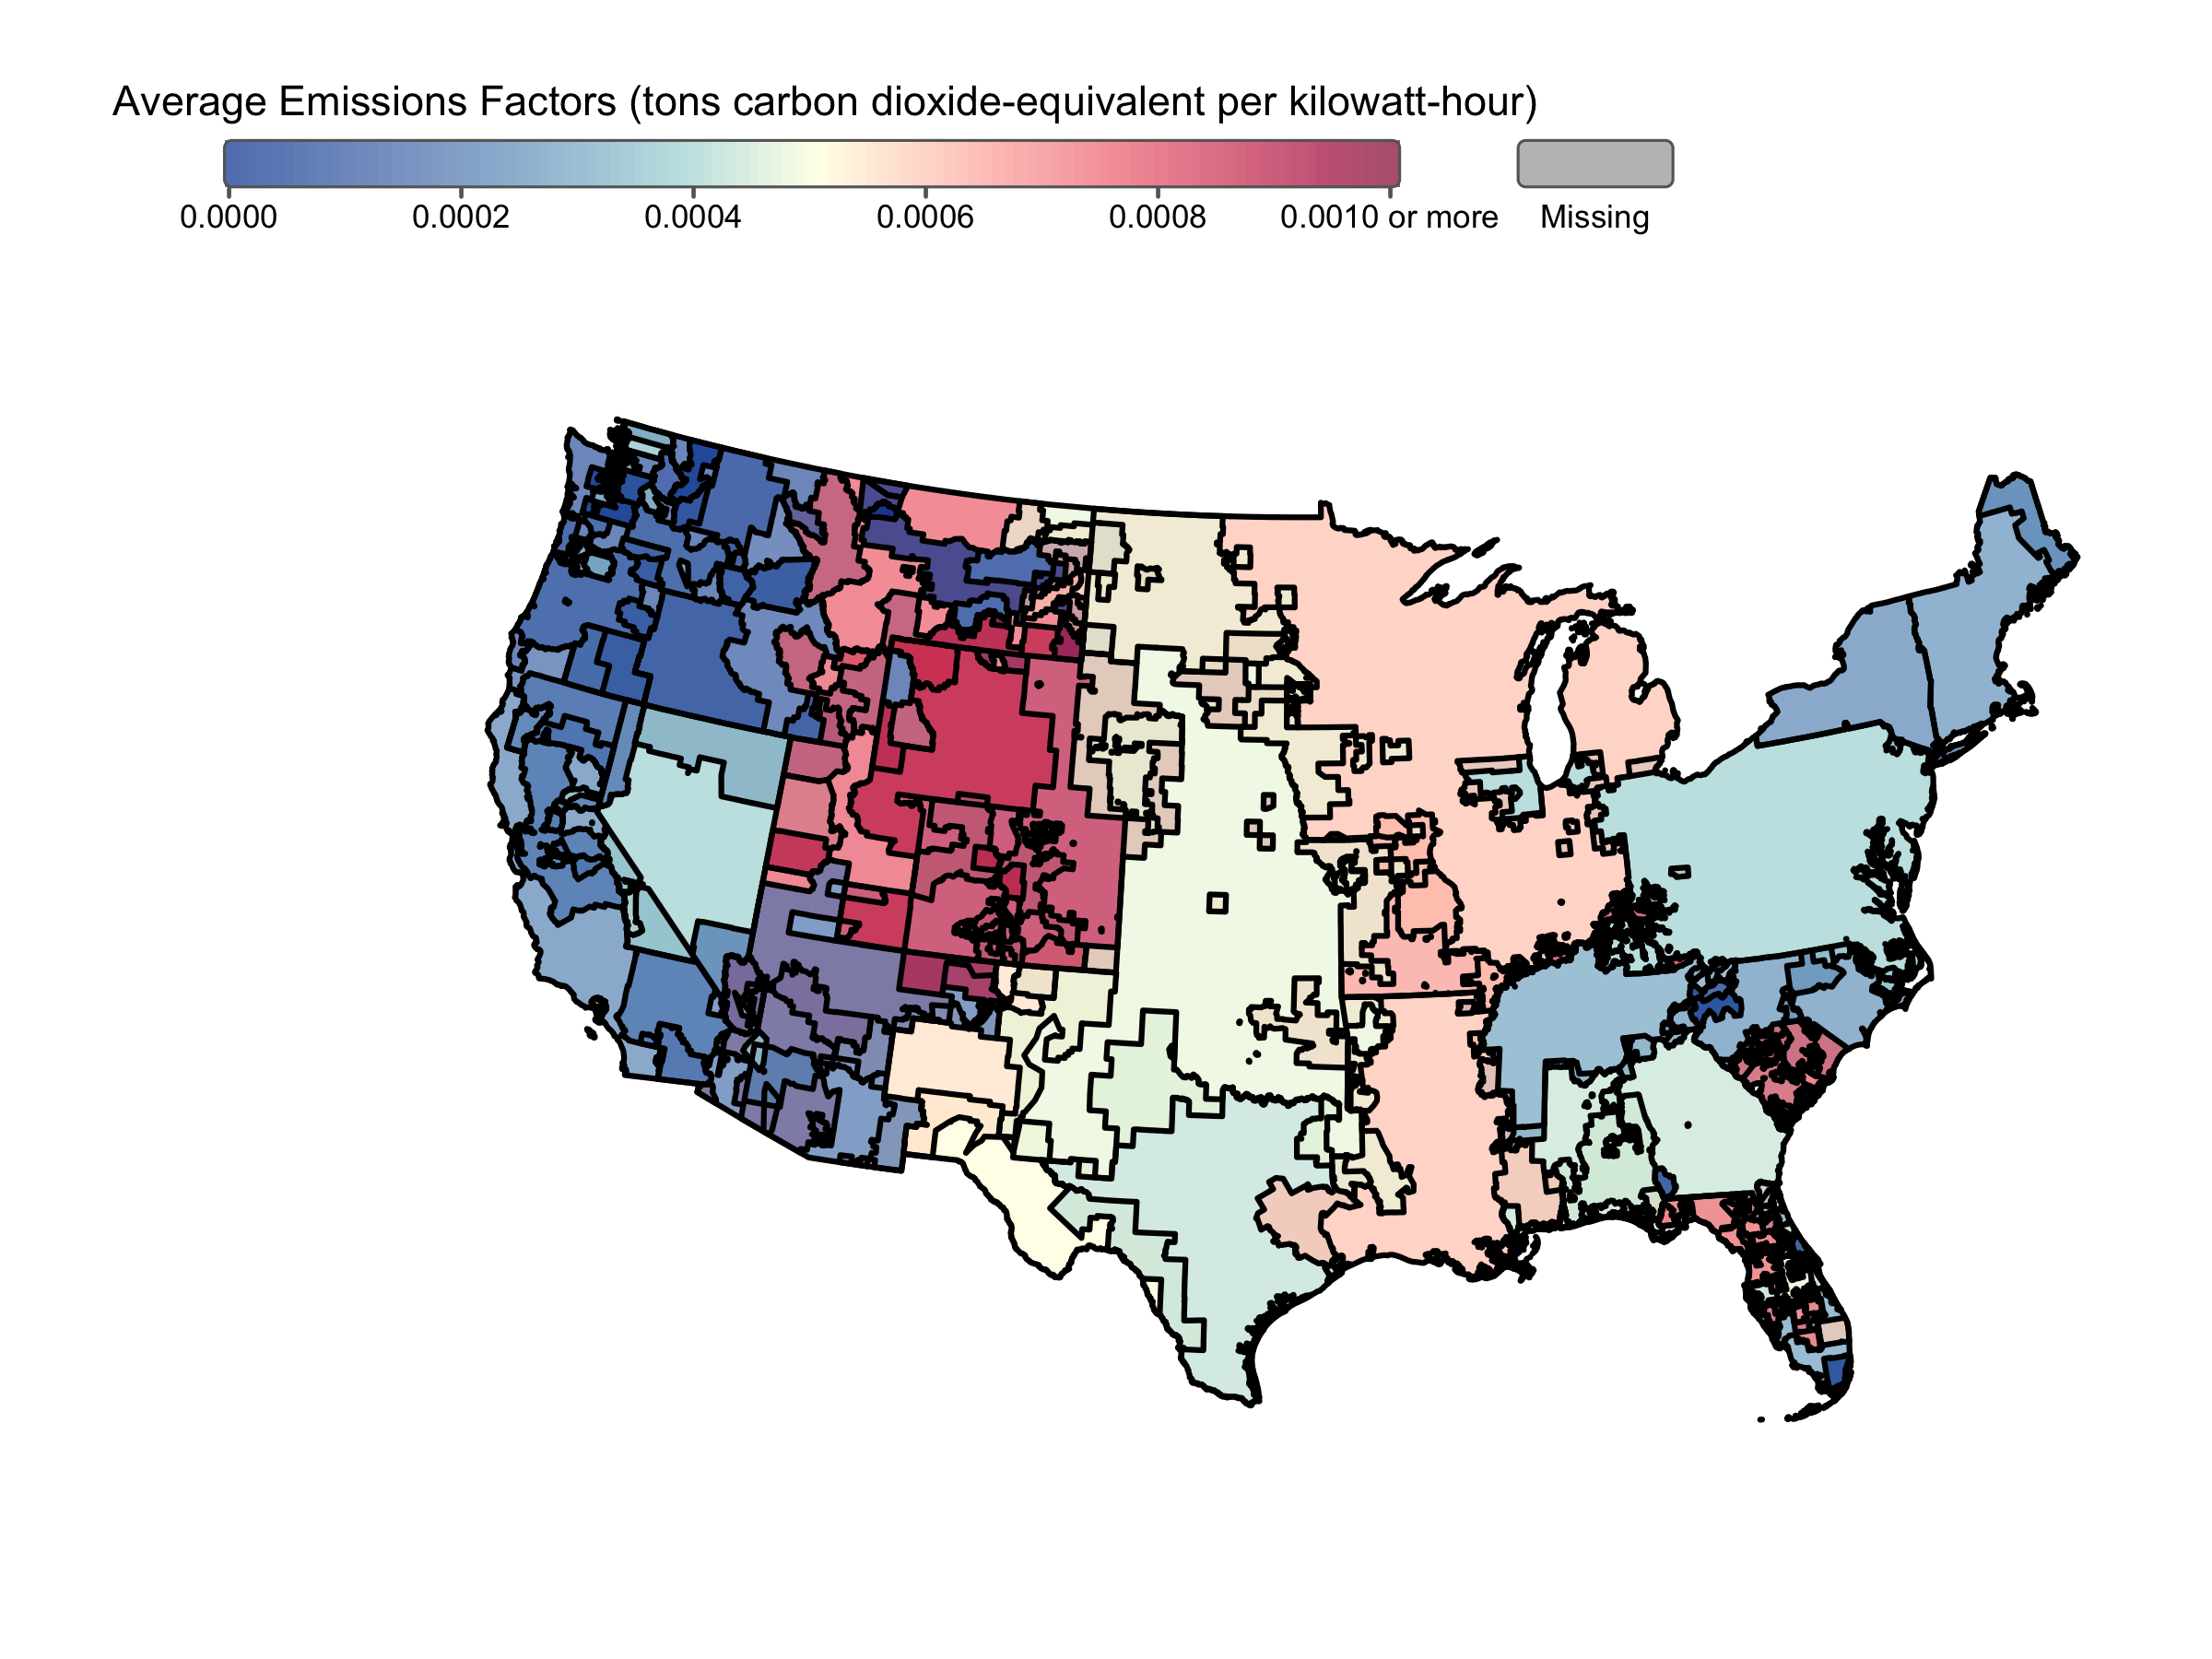
Figure 8. Average grid emissions factors, 2019-2021. Source: ICE Climate as of 06/20/2024. Source: ICE Climate as of 06/28/2024.
The emissions intensities of regional electricity grids across the country are reflected in estimates of state-by-state compliance with New York’s Local Law 97’s 2024 emissions intensity limits. The grid in Washington State, for example, is more efficient in terms of emissions per kilowatt hour of electricity generated than the grids in Wyoming and Colorado (Washington State is powered by significant amount of hydropower). These differences mean that a building in Washington State could use significantly more electricity over the course of a year than a building Colorado and still be compliant with Local Law 97’s 2024 limits, while the lower-energy-usage building in Colorado might easily exceed the intensity limits. For more on grid emissions efficiency, building emissions, and implications, please see these articles.
Nationwide, over 112,000 large (>25,000 square feet) buildings, or about 20% of the over 580,000 total large buildings in ICE Property Assessment Tables, are out of compliance with New York’s 2024 emissions intensity limits, due to a combination of building energy usage and regional electricity grids powered by carbon-intensive fuels like coal and natural gas. Many of the most non-compliant large buildings are concentrated in states like Texas, Florida, and Colorado that either have large numbers of large buildings overall, high grid emissions factors, or both. (California has the largest number of large buildings, however it has a low average grid emissions factor when compared to most of the country; Figure 8.) These patterns suggest that “greening the grid” and increasing building efficiency could have a particularly large impact in terms of absolute building-related emissions reductions in Texas, Florida, Colorado, Arizona, Michigan, Ohio, Illinois, and Missouri (e.g., Figure 9).
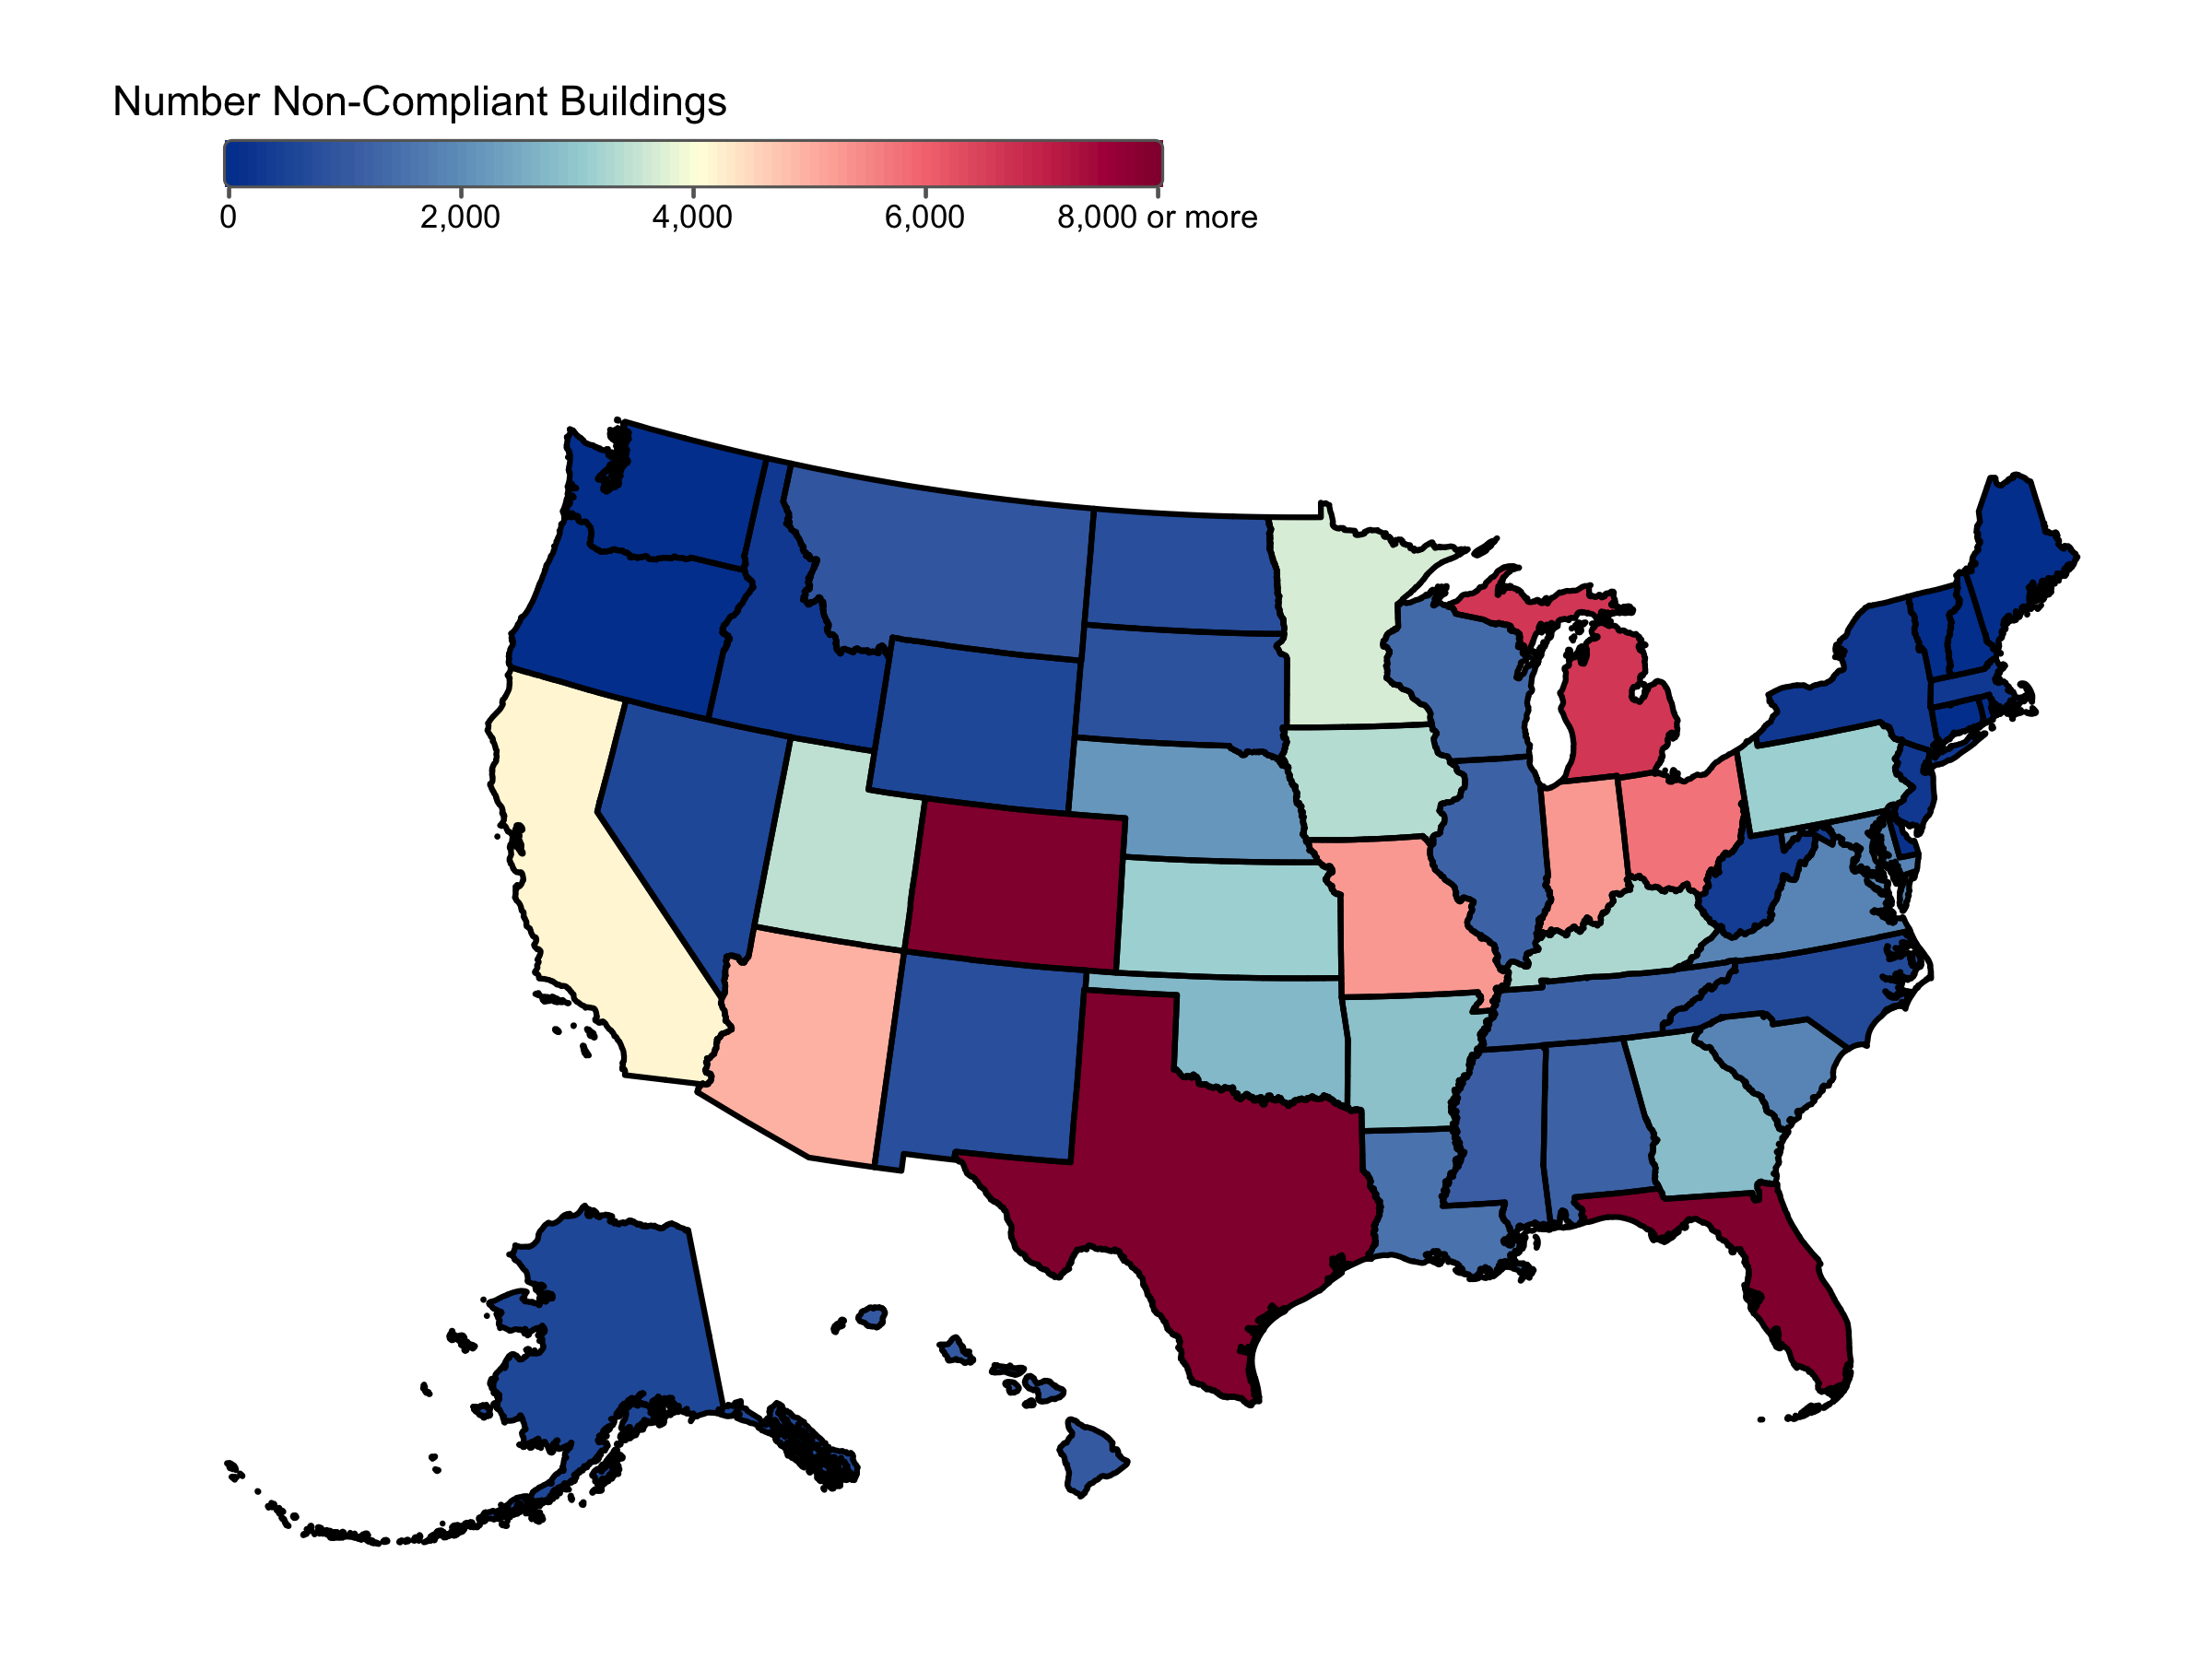
Figure 9. The estimated number of non-compliant large (> 25,000 square feet) buildings (based on Local Law 97’s 2024 intensity limits and location-specific grid emissions factors from Singularity) by state across the county. Source: ICE Climate as of 06/28/2024.
The percentages of buildings that would be non-compliant under a National Local Law 97 more closely reflect regional patterns of grid emissions factors. In general, a greater proportion of buildings are estimated to be non-compliant with Local Law 97 intensity limits in states located in the middle of the county, where average grid emissions factors tend to be higher. In percentage terms, Texas and Florida have relatively few non-compliant buildings (Figure 10).
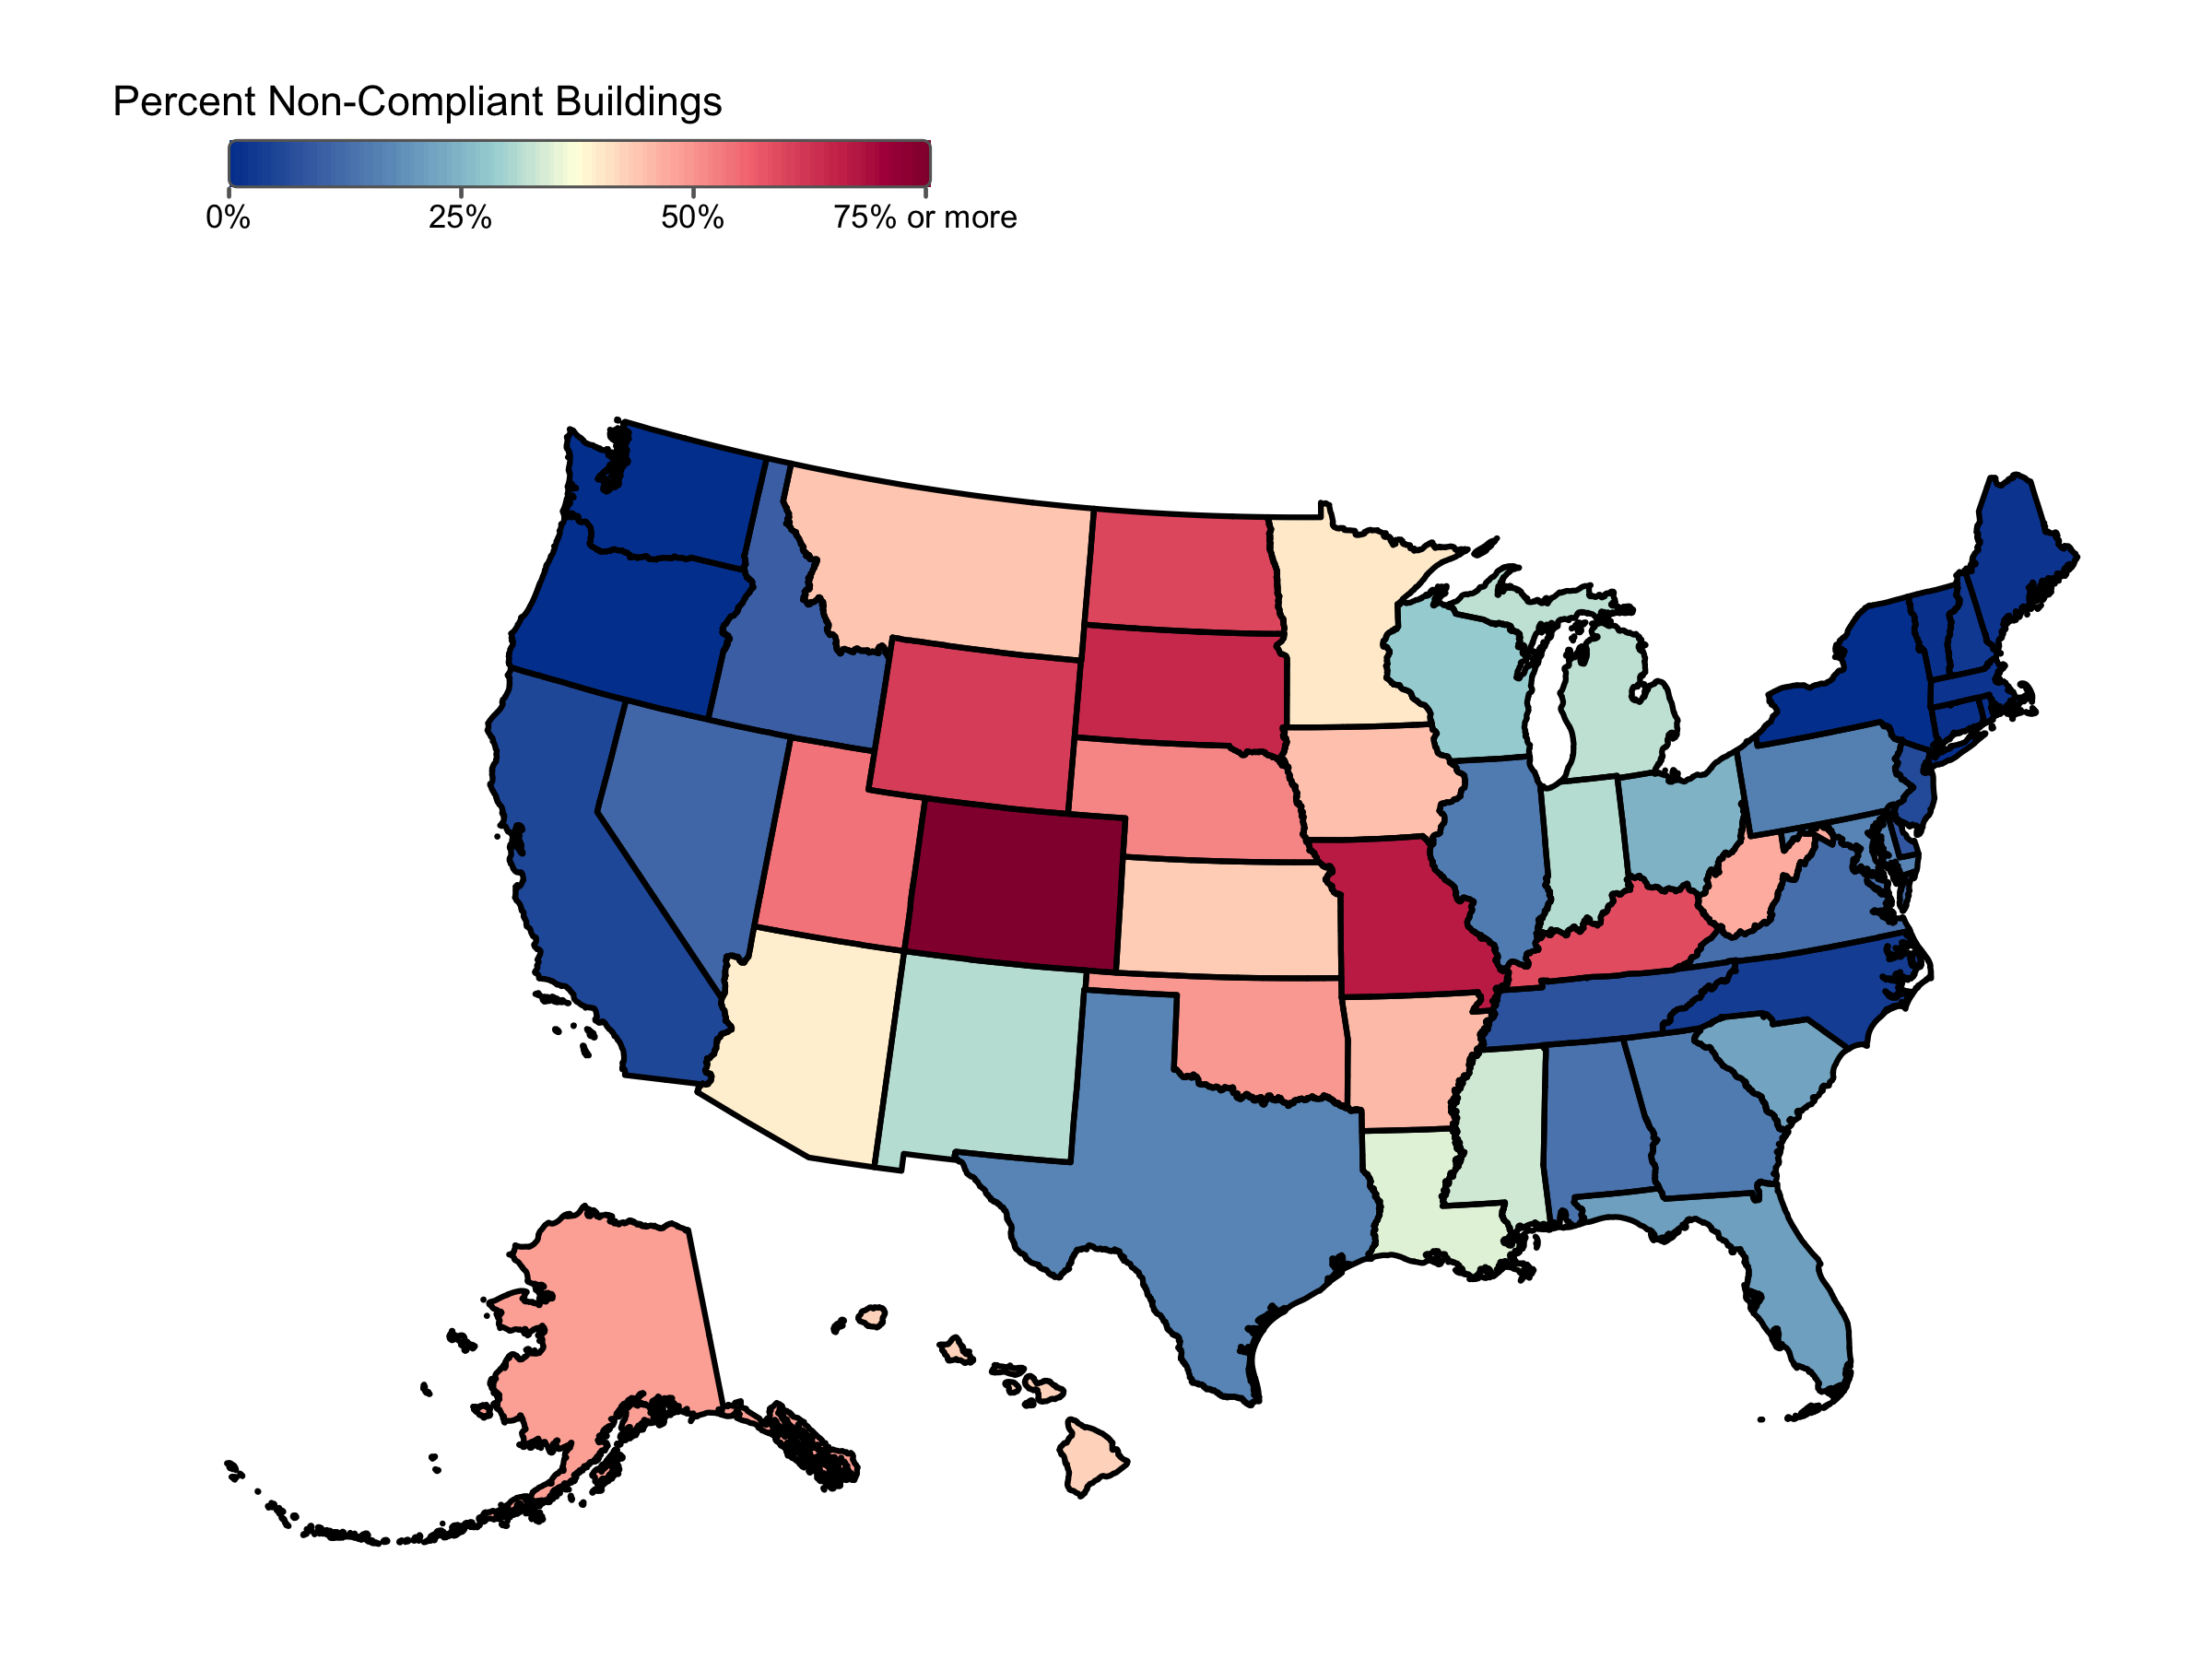
Figure 10. The estimated percentage of large (> 25,000 square feet) buildings that are non-compliant in each state under New York’s Local Law 97 limits for 2024. Source: ICE Climate as of 06/28/2024.
If all non-compliant large buildings across the country were to come into compliance with Local Law 97’s 2024 emissions intensity limits overnight, the total aggregated reduction in nationwide building-related emissions would be about 33 million metric tCO2-equivalent, or about 0.5% of the total American emissions footprint. To encourage a meaningful shift to a lower carbon economy, reducing the emissions of large buildings is important—but it will likely only be a part of any successful nationwide strategy.
The ICE Climate approach to estimating energy usage and emissions for residential and commercial properties in the United States incorporates physics-based building energy models (BEMs) developed by the Energy Information Administration (EIA) and the National Renewable Energy Laboratory (NREL). These models estimate current energy usage, both from electricity and onsite fuel use, based on various factors such as weather zone, heat fuel source, and physical building characteristics. ICE Property Data Records, which include detailed information on building characteristics for over 150 million buildings in the United States, are then used to match real buildings with NREL's energy usage simulations based on specific sets of property characteristics.
On-site emissions (Scope 1) from natural gas, propane, and fuel oil are calculated using the BEM estimates of annual fuel consumption multiplied by conversion factors for the type of fuel consumed. Off-site emissions (Scope 2), sourced from the electrical grid, are calculated based on hourly electricity use per building coupled with the hourly location-based emissions factors for electricity generation, aggregated annually. Grid emissions factors are sourced from a company called Singularity, and these factors are matched with property locations to determine the appropriate emission coefficients. The resulting dataset provides property-level Scope 1 and Scope 2 emissions estimates. Total annual emissions for each property are the sum of Scope 1 and Scope 2 components, and emissions intensities are estimated by dividing total emissions by building area.
Lauren Patterson
Contact us for any questions about our wealth solutions
Contact us for any questions about our wealth solutions