Understanding the impacts of water stress
Many countries are projected to have their water stress rise in coming decades. Now, metrics allow market participants to understand the potential impacts of water stress around the world.
Published
February 2024
Nanki Sekhon
Data Analyst, ICE Sustainable Finance
Carly O’Rourke
Research Analyst, Climate & ESG
Phoebe Devries
ICE Sustainable Finance Research and Content
In early 2018, the city of Cape Town, South Africa faced a water crisis. Three years of drought, outdated infrastructure, and poor planning had led to record low water levels in the city’s reservoirs. For months, the city’s 4.6 million inhabitants faced the imminent threat of “Day Zero,” the day when the city would simply run out of water. A combination of government awareness campaigns, restrictions, tariffs, and a new water pressure system eventually averted Day Zero, but the crisis came at significant cost.1 The overall economic impact of the drought on the Western Cape—the province in which Cape Town is located—was estimated to be 3.4% of the province’s GDP and 0.3% of South African GDP.2 International financial markets took notice: Moody’s issued a report in 2018 saying that the water crisis in the city was credit negative and there were fears at the time that the whole of South Africa would be downgraded.3
South Africa is not the only place to be severely impacted by water shortages in recent years. California’s drought in 2021 cost the agricultural sector in the state more than $1.1 billion. A lack of precipitation in the summer of 2017-2018 in South America led to losses upwards of $3.5 billion in Argentina and Uruguay.4,5 Kenya, Somalia, and Ethiopia experienced a multi-season drought that started in 2021 and killed an estimated 3.6 million livestock.6 Taps ran dry in the city of Monterrey, Mexico in the summer of 20227 and in parts of Southeast England in the summer of 2023.8
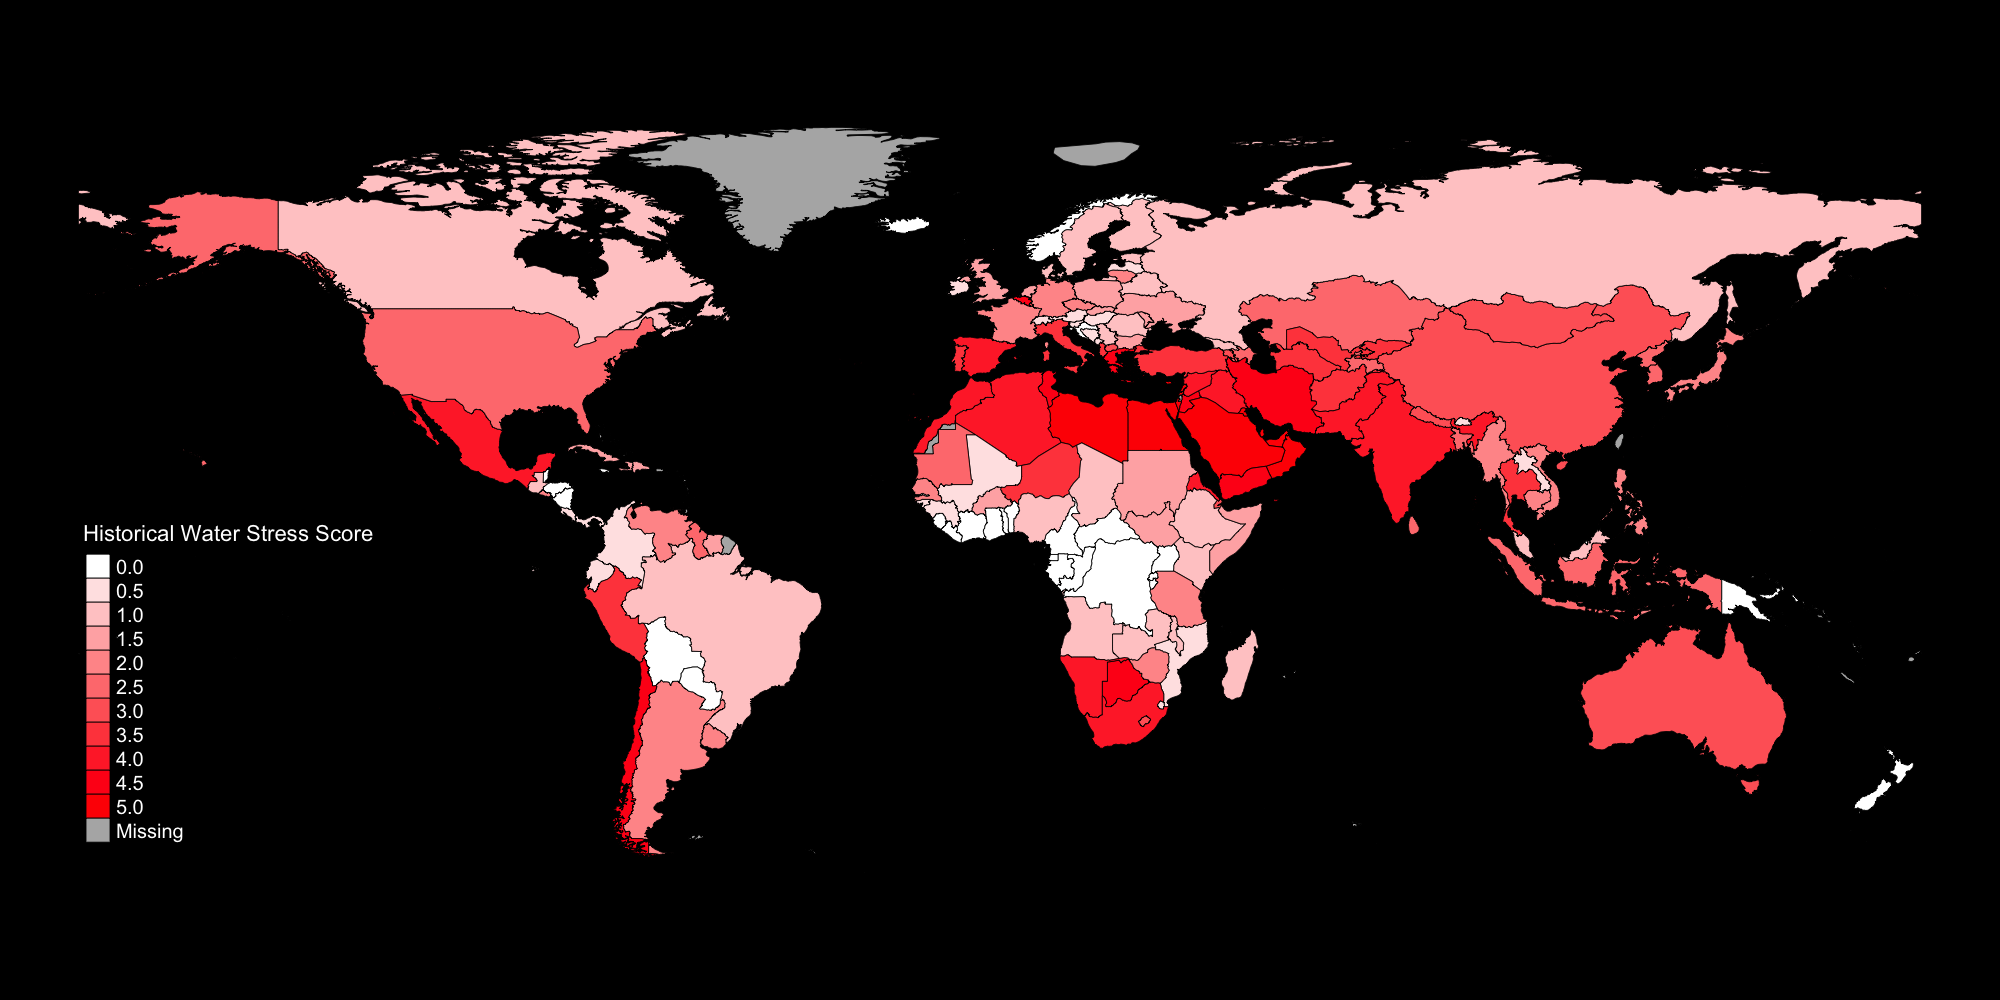
Historical Water Stress Scores across the globe. Source: ICE Sustainable Finance as of 10/21/2023.
Water stress depends on both the use and availability of water—specifically, it is defined as the ratio of water demand to water supply. Water stress scores come directly from publicly available scores provided by the Water Resources Institute (WRI).9 The WRI provides water stress estimates and projections under several Shared Socioeconomic Pathways and emissions scenarios (SSP1-2.6, SSP3-7.0, and SSP5-8.5) that were created to provide guidance for researchers helping direct a global response to the climate crisis. Countries are projected to have their water stress increase to varying degrees over the coming decades relative to historical values. These differences are due to the combination of water supply and water usage, including the effects of projected population changes under the Shared Socioeconomic Pathways.
The water stress scores are easily interpretable (5 represents the highest stress, 0 the lowest) enabling market participants to understand the current and future potential impacts of water stress on countries around the world.
Animation of changes in Water Stress Scores under Shared Socioeconomic Pathway 5-8.5 from 2030 to 2080. Most countries are projected to have their water stress increase over the coming decades, relative to historical values.
1 Hill-Lewis, G. (22 Mar 2023). Cape Town: Lessons from managing water scarcity. Brookings Report
2 2030 Water Resources Group. (Sep 2022). The Economic Implications of Water Resources Management in the Western Cape Water Supply System. Discussion Paper, The World Bank Group
3 Staff (30 Jan 3018). South Africa at risk of credit downgrade due to Cape Town drought: report. BusinessTech
4 Anderson, L. (4 Feb 2022). Last year’s drought cost ag industry more than $1 billion, Thousands of Jobs, New Analysis Shows. UCMerced Newroom
5 Masters, J. (30 Mar 2018). Most Expensive Weather Disaster of 2018: a $3.9 billion drought in Argentina and Uruguay. Weather Underground
6 World Meteorological Organization (30 May 2022). Press Release: Meteorological and humanitarian agencies sound alert on East Africa
7 Gottendiener, L. (20 Jun 2022). Dams, taps running dry in northern Mexico amid historic water shortages. Reuters
8 Seabrook, V. (14 Jun 2023). Schools forced to close in parts of southeast England after taps run dry in heatwave. SkyNews
9 The World Resources Institute is a non-profit organization that conducts sustainability research globally. More information