ICE | Most Wx Providers | Most Desktops | |
|---|---|---|---|
| Weather Forecast Models | |||
| GFS (Op) | ✓ | ✓ | No |
| GFS ENS | ✓ | ✓ | No |
| ECMWF (Op) | ✓ | ✓ | No |
| ECMWF ENS | ✓ | ✓ | No |
| ECMWF EXT | ✓ | ✓ | No |
| GFS ENS EXT | ✓ | ✓ | No |
| SEAS (7mo) | ✓ | ✓ | No |
| CFS (9mo) | ✓ | ✓ | No |
| Weather Observations | |||
| Real-time Airport Weather (METAR) | ✓ | ✓ | ✓ |
| 41 years of Hourly Obs data | ✓ | No | No |
| Trailing 10yr CLIMO | ✓ | No | No |
| Trailing 15yr CLIMO | ✓ | No | No |
| Trailing 30yr CLIMO | ✓ | No | No |
| Official 30yr CLIMO (81-10) | ✓ | ✓ | No |
| Weather Forecast Parameters | |||
| 200+ weather parameters | ✓ | No | No |
| Hourly parameters | ✓ | ✓ | ✓ |
| Daily parameters | ✓ | ✓ | ✓ |
| Multi-Day parameters (calendar weeks, gas weeks, etc..) | ✓ | ✓ | No |
| CHNG fields (6,12,18,24 hrs ago) | ✓ | ✓ | No |
| ANOM fields (using 4 Climos) | ✓ | ✓ | No |
| Weather Data (Global Locations) | |||
| 2,000+ global locations | ✓ | ✓ | No |
| 150+ US Power & Gas Regions | ✓ | No | No |
| 200+ polygons covering most major global countries, provinces, states, and/or regions | ✓ | No | No |
| Weighted Regions/Polygons for important agriculture and wind generation regions | ✓ | No | No |
| Add locations on-demand | ✓ | ✓ | No |
| Weather Data Delivery | |||
| Interactive Fin tech Desktop | ✓ | No | ✓ |
| Excel and Python Real-time Delivery (RTD) | ✓ | No | No |
| Consolidated Low latency Data Feed Delivery (ODB) | ✓ | No | No |
| Advanced Symbology | ✓ | No | No |
| Comprehensive Weather Maps | |||
| Hourly Guidance | ✓ | ✓ | No |
| Daily Guidance | ✓ | ✓ | No |
| Multi-Day Guidance | ✓ | ✓ | No |
| Forecast Progression Maps | ✓ | ✓ | No |
| Forecast Performance Maps (Error and Bias) | ✓ | ✓ | No |
| Model Change and Anomaly Maps | ✓ | ✓ | No |
| Observation Maps | ✓ | ✓ | No |
| Detailed Model Status Pages | |||
| Monitor forecast data delivery speed | ✓ | No | No |
| View previous data delivery times | ✓ | No | No |
| Monitor data delays | ✓ | No | No |
| Unique Weather Workflows | |||
| Advanced (patent pending) Weather Symbology (aka Weather Legos) | ✓ | No | No |
| Ability to create any desired weather table or chart or desktop functionality quickly (using Weather Legos) | ✓ | No | No |
| Customizable Weather Alerts on streaming weather forecasts, weather observations, market prices, etc | ✓ | No | No |
| Create high value "weather vs commodity price" visualizations (patented technology) | ✓ | No | No |
| Be the first to identify new trading opportunities by quantifying "Weather Alpha" among a wide array of traded commodities | ✓ | No | No |
Fixed Income & Data Services/Access & Delivery/Desktop & Web Platforms/ICE Connect/ICE Connect Weather
Weather
In the realm of commodity markets, weather observations are indispensable for gauging supply and demand impacts. However, it's the evolving perceptions derived from key weather forecast models that can influence future market prices. ICE has revolutionized this traditionally analog process by digitizing it, integrating streaming weather forecast data into next-generation weather workflows within the ICE Connect Desktop. This pioneering approach combines streaming weather with market prices.
Explore asset class coverage
Key benefits
- Transformative Weather Workflows including live streaming weather, market prices and changing weather forecasts in real-time and explore their historical impact on market prices
- Customization and flexibility to effortlessly create personalized layouts or views within the Desktop and create customizable Weather Alerts tailored to your specific needs
- Comprehensive access to ICE’s ODB API grants company-wide access to real-time weather data and benefit from Tier 1 weather vendor services embedded into a cutting-edge 'FinTech' trading Desktop
- Customizable weather alerts to notify you on fast-changing prices or weather perspectives
- Design your own personal views using ICE’s weather symbology to help create trading edge
- Access ICE’s unique patented visualizations to view streaming weather and market prices
Stream and analyze the relationship between natural gas prices and weather patterns
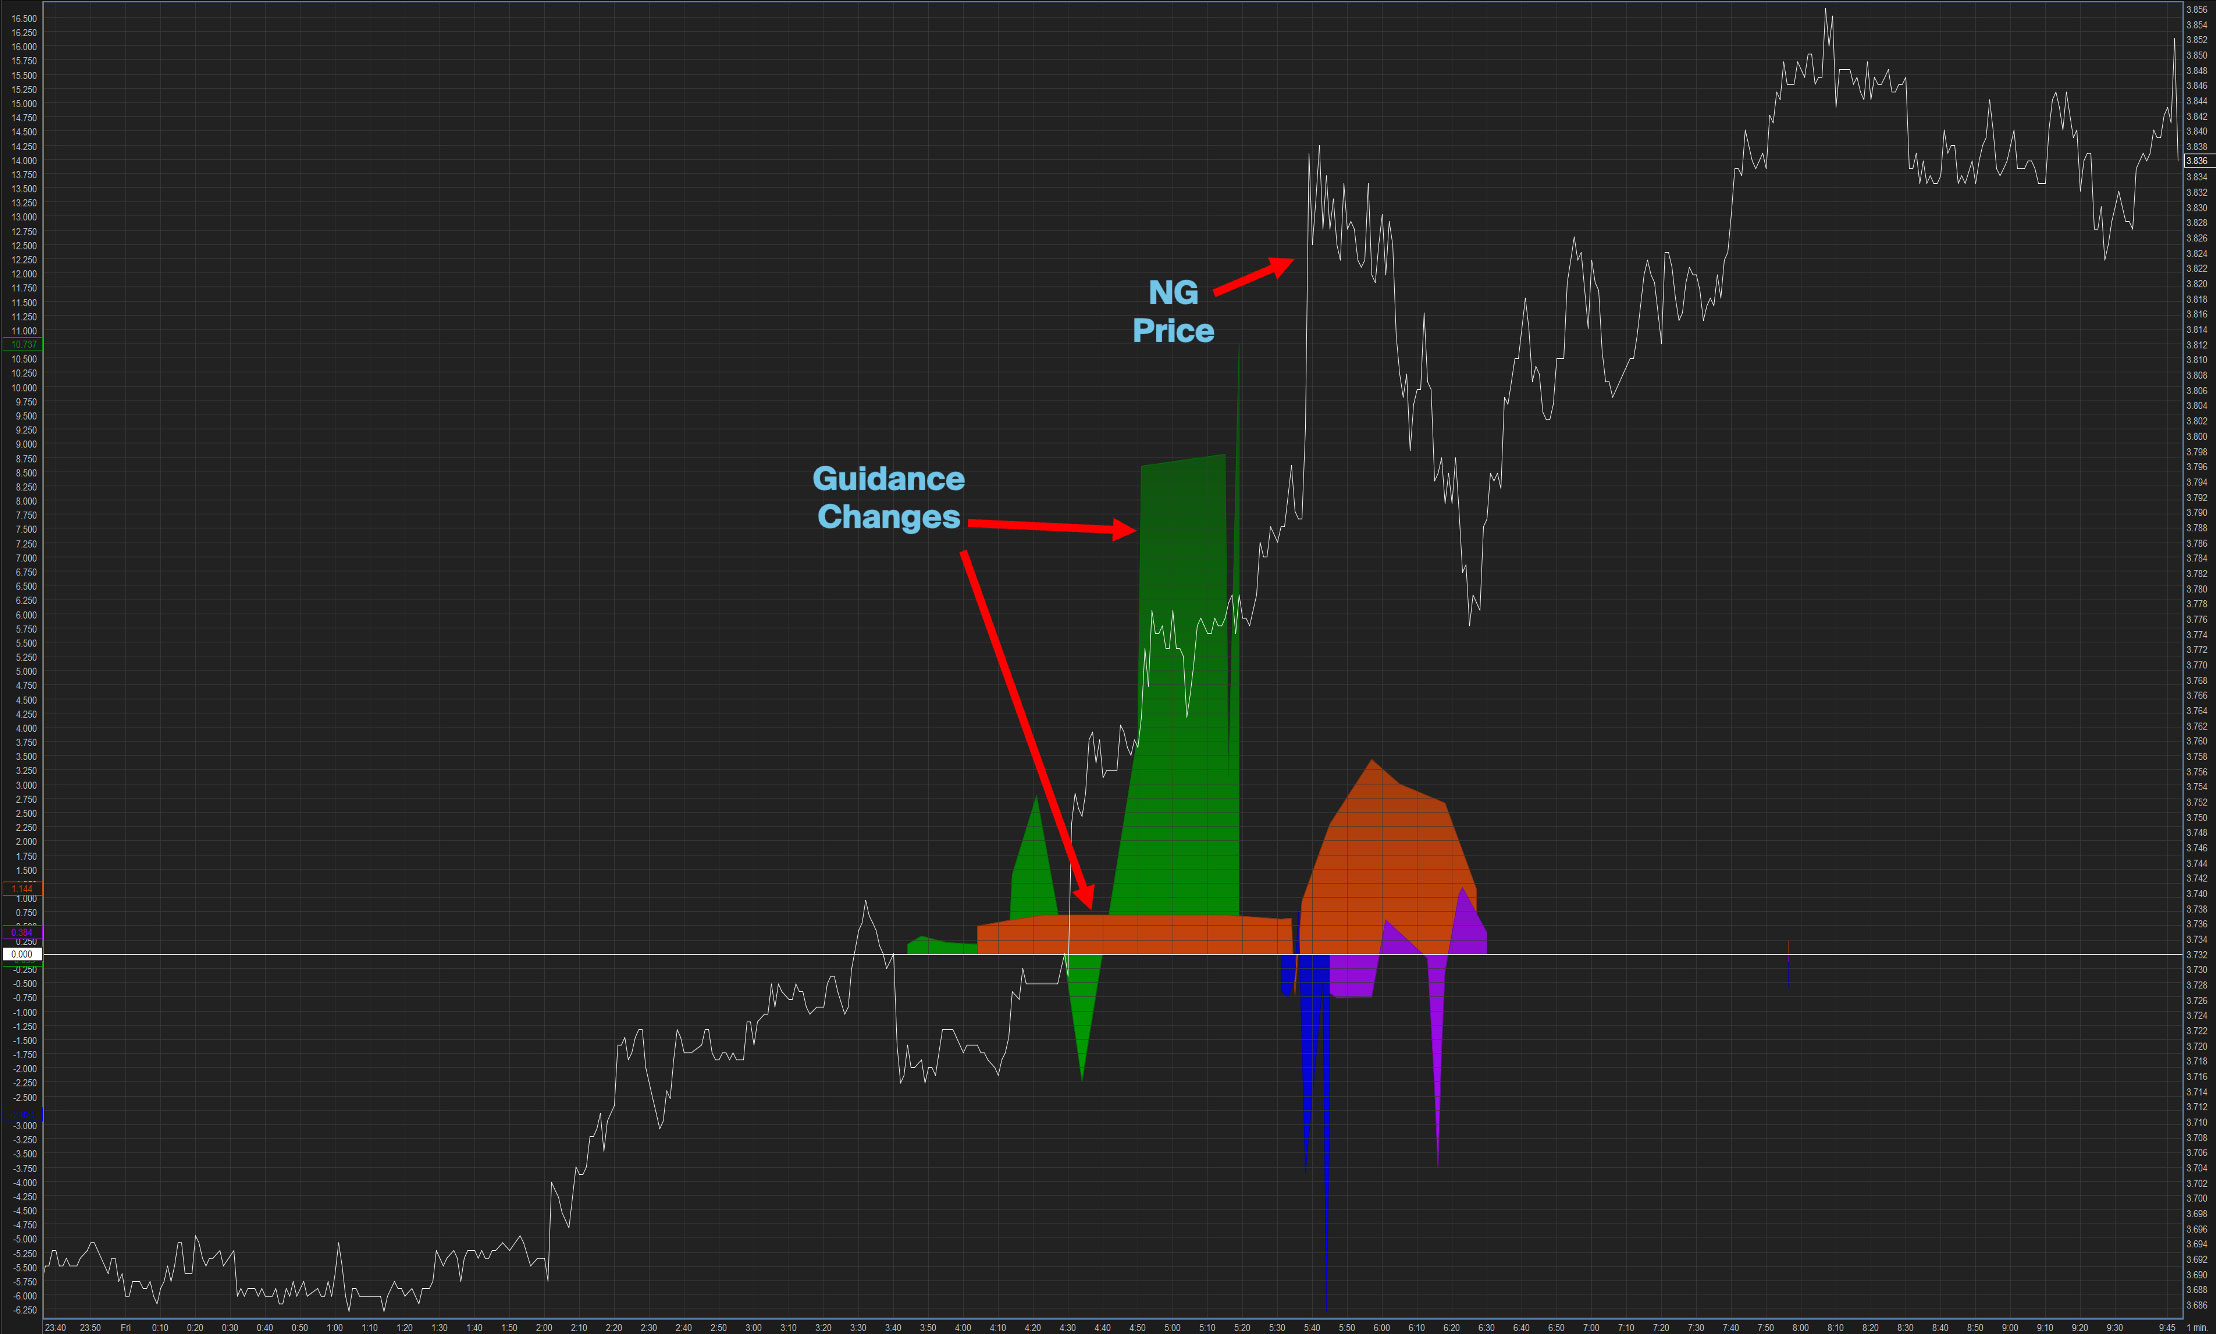
Users can stream price (line chart) and weather data (area charts) for near instantaneous information on weather’s potential impact on price. In this example the GFS model (green area chart) and later other guidance showed a significant increase of HDD’s that coincided with a significant increase in nat gas price.
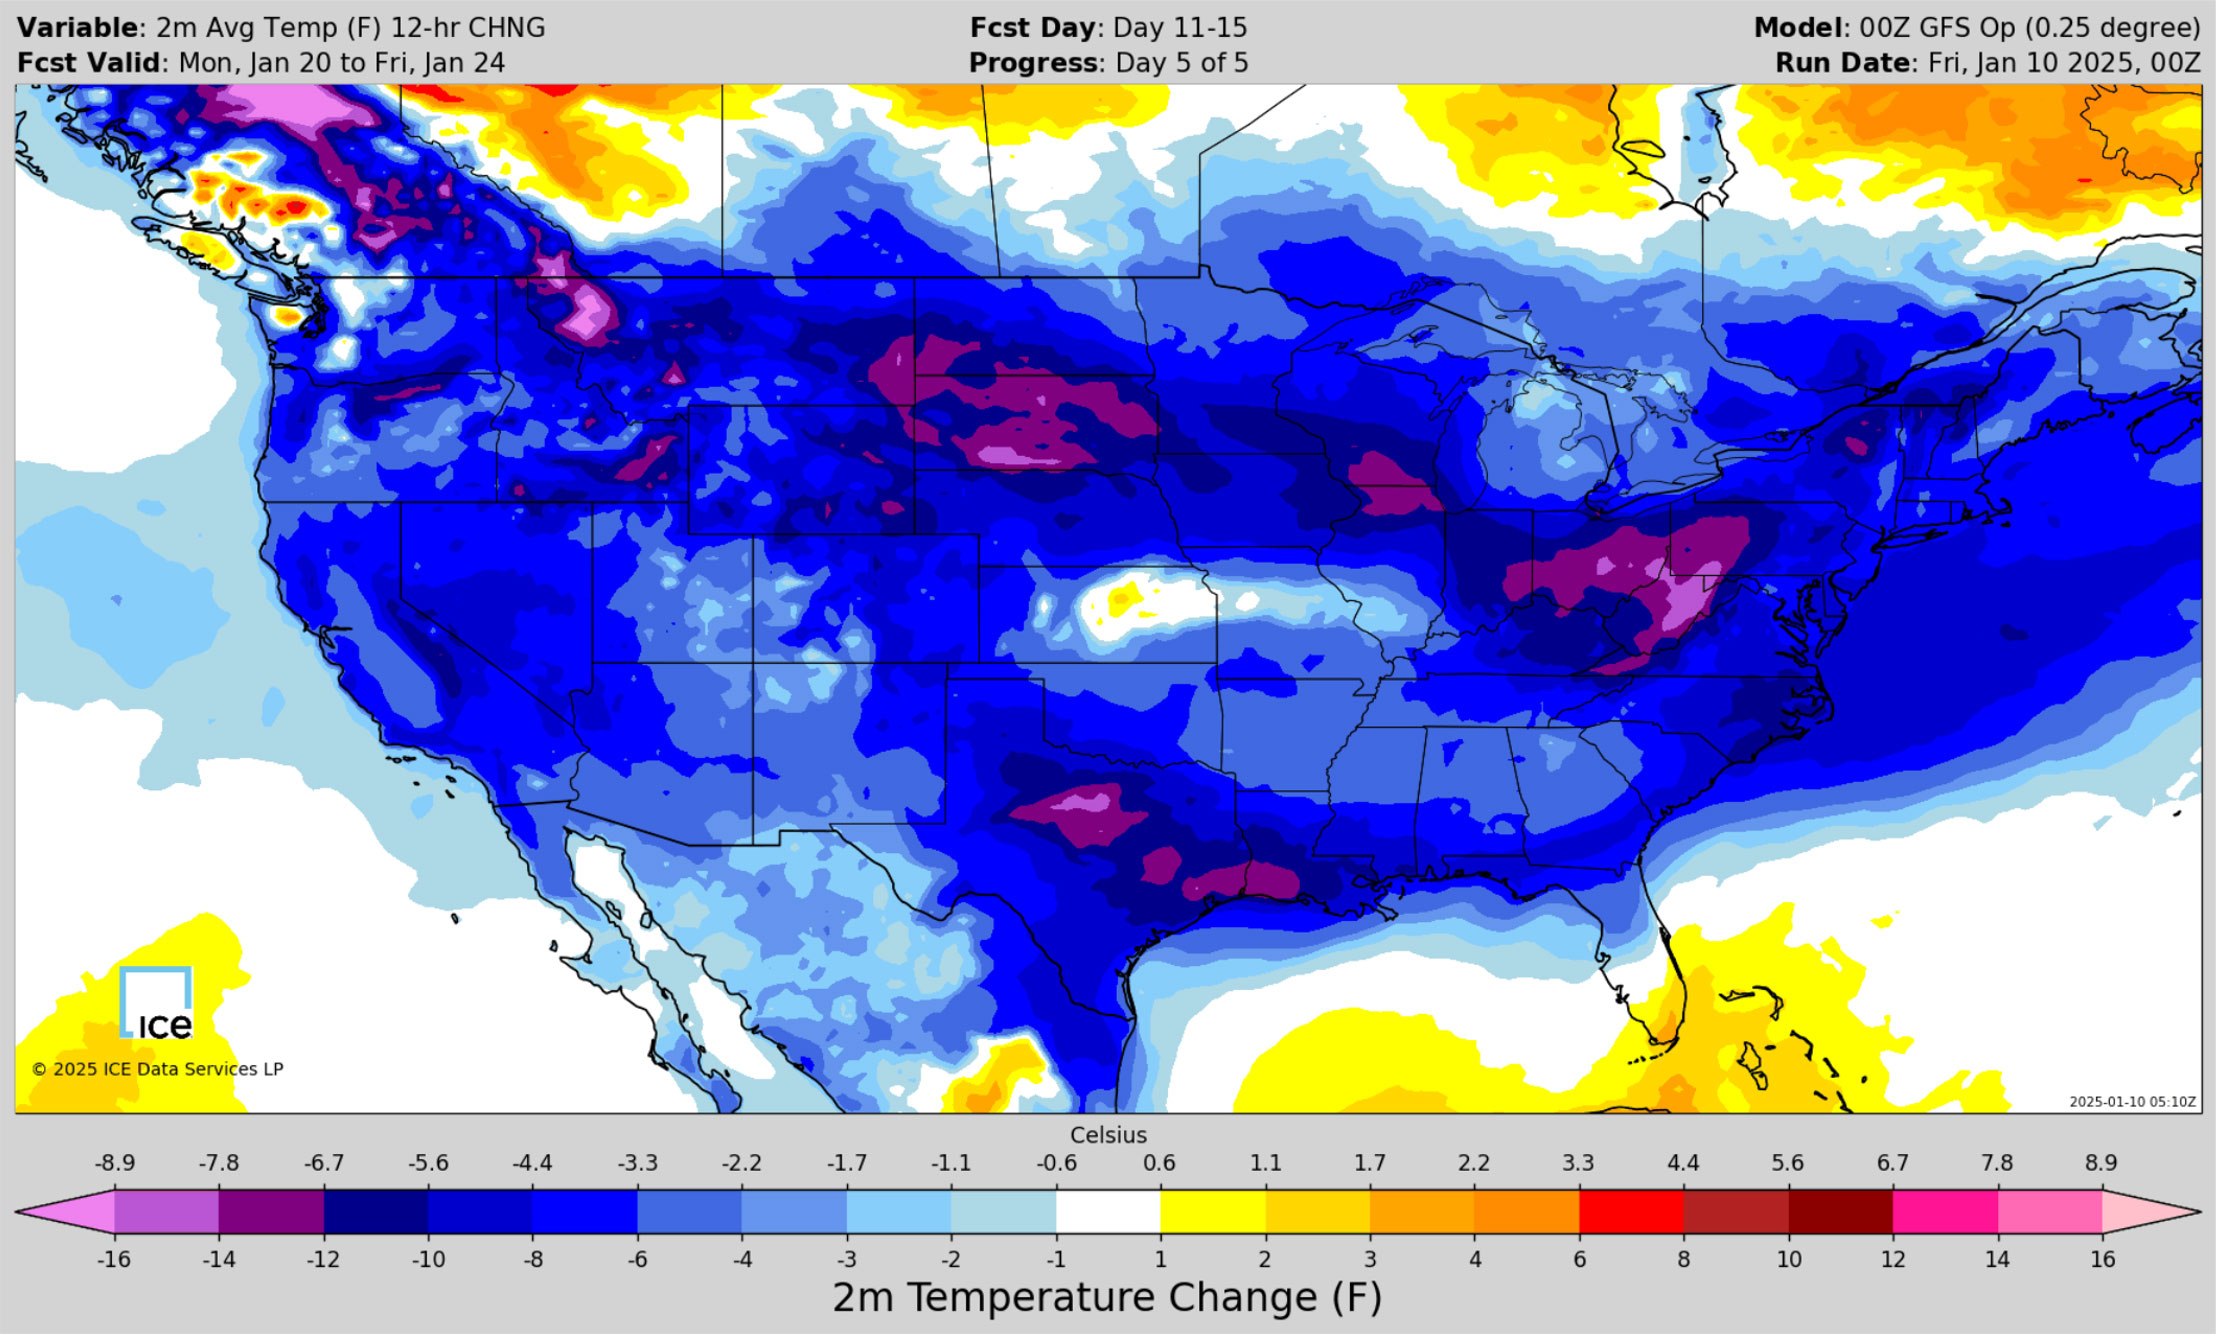
GFS Operational 12-hr change map for the 11-to-15-day period. Maps help contextualize information that can’t be known from an index such as the areal coverage and intensity of an airmass. In this example the GFS model showed colder changes for much of the county with the most intense changes across the Midwest and Texas.
Insightful Weather Data
- Stream medium- and long-range weather forecasts from key government forecast models
- Very high spatial and temporal resolutions of all government forecast models
- 200+ weather forecast fields including Gas Weighted Degree Days, snow, wind, solar, soil moisture, liquid precipitation, temperatures, humidity, pressure, etc
- 1,000+ global locations and 6,000+ locations ready to add upon request
- 30+ years of daily and hourly weather observations for all 200+ forecast fields and all locations
- Pre-calculated climatology for trailing 10, 15 and 30 years as well as the official 30 year
- Robust archive of weather forecasts which also include timestamps as to when these forecasts were available in the public domain
- Design your own personal views using ICE’s weather symbology to help create trading edge
- Access ICE’s unique visualizations (patent pending) to view streaming weather and market prices
- Customizable weather alerts to notify you on fast-changing prices or weather perspectives
- Stream weather maps with over 1 million maps per day
- Streaming weather forecast grids tailored for your markets
- All weather data is accessible via the ICE Connect Desktop, ICE XL (Excel add-in) and Python (R & VBA coming soon)
- Directly link weather details to specific traded instruments to quickly visualize changing market conditions
- Excel RTD feeds eliminate the need for manual data refreshes
- ICE Python allows users to handle large datasets and apply advanced data processing techniques efficiently
- ICE’s ODB API allows company wide access to all weather data delivered in real-time
- Understand how fast and how much your markets are influenced by changing weather through key visualizations
- Quickly assess weather forecast risk with efficient analysis as key weather forecasts begin to converge on accuracy
- Convert extremely large weather data streams into actionable knowledge to help provide trading edge (24x7x365)
- Reduce costs with a highly-efficient platform providing greater data access and superior functionality to your daily workflows
Weather forecast data and analytics comparison
Optimization solutions
- Tailored for financial markets with intuitive, flexible, and powerful data visualization
- Enhance productivity and minimize risk with dynamic worksheets
- Features include Historical Data, Time & Sales, Forward Curve Builder, Options Analytics, and Market Depth
- Unlock ICE Data via Python for Quotes, Time Series, and Time & Sales
- Access historical aggregated bar data with intervals as granular as 1-minute
- Real-time, delayed, and T+1 historical data available across various asset classes and exchanges
- Streamline market communications and enhance trading decisions with the ICE Chat application
- Leverage the Chat API for information delivery and process automation
- On-Demand Bars is an HTTP based API solution that provides to access open, high, low, close historical aggregated bar data on an end-of-day and intraday basis with intervals as granular as 1-minute. Data spans hundreds of exchanges, multiple asset classes, with up to 30+ years of history and is available in real-time, delayed and T+1 historical qualities
- Powering web-based charting applications
- Plot real time, delayed, intraday and historical end of day aggregated OHLC bars to create visually appealing web-based charts
- Model validation and historical analysis
- Model trading strategies to assess performance and viability. Perform in-depth historical analysis to identify market trends
Complimentary newsletter for ICE Chat users
Comprehensive analysis of weather forecasts from some of the most regarded medium range weather models including GFS, GFS ENS, ECMWF and ECMWF ENS. Subscribe to start receiving your weather newsletters today.