

Inflation: will the genie return to its bottle once pandemic price pressures pass? For the moment, financial markets seem to agree with the Fed’s view: that inflation pressures are transitory or already priced in. Perhaps more interesting is the potential long-term impact of the Fed’s new inflation policy on bond markets. Tolerating longer periods of higher inflation to achieve a 2% average over time could make asset prices more sensitive to changes in yields. Some argue this could present a duration challenge for investors, and ultimately change the dynamic of bonds being viewed as a hedge for equities. In the nearer term, we’ve already seen ‘lower rates for longer’ feed voracious corporate appetite for debt. If that becomes the new norm, higher debt levels against a lower rate backdrop could force a recalibration of investor risk tolerance.
Evidence that investors are still on board with the central bank’s hypothesis has abounded in recent weeks, with several inflationary indicators normalizing. Among the more eye-catching moves, lumber futures fell more than 40% from peak levels in May, providing relief to real estate supply/demand technicals that had been turned upside and resulted in a $36,000 increase in the cost to build a new home on average this year, according to the NAHB. Another sign of optimism: our indices show that investors are demanding less yield to hold US corporate debt, with the premium between corporate debt and Treasuries at its lowest level in over a decade.
More traditional inflation metrics like gold have also come under pressure, with bullion prices down nearly 7% month-over-month. The fixed income crowd would likewise point to their preferred canaries in the coal mine, TIPS break-even rates and Treasury yield curve steepness, both of which have declined from 2021 peaks.
Amid inflation jitters, one gauge we’re keeping a close eye on is the MOVE - the often-overlooked index which captures fear in the bond market. Inflation was already at its highest level since 2008 when the Fed brought forward its rate rise projections this month, triggering a brief slide in equities and a jump in Treasuries. Now, all eyes will be to Jackson Hole. The Fed has indicated it’s just a step away from “talking about tapering” and that symposium has historically been a forum for policy announcements.
Five things we’re watching
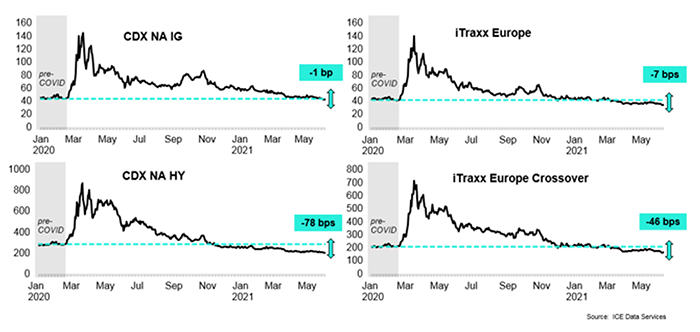
Credit Default Swap spreads are now tighter than pre-COVID levels in the US and Europe for both Investment Grade and High Yield indices. The lack of a meaningful selloff in benchmark interest rates, lower bond market volatility, and continued reopening of economies have been key drivers.
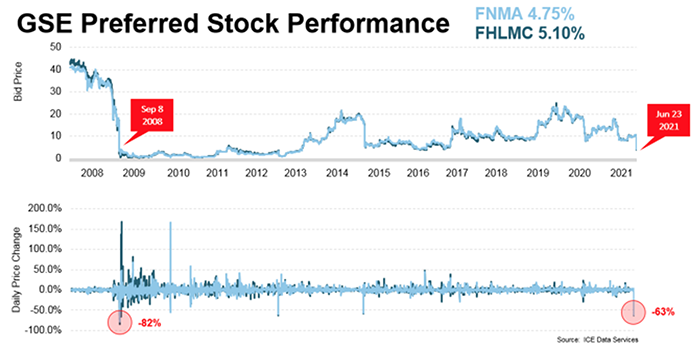
In the wake of a Supreme Court ruling which dismissed claims the FHFA exceeded its authority under federal law, Preferred Stock issued by Fannie Mae and Freddie Mac has come under pressure, leaving prices down more than 60%, the worst one-day performance since the financial crisis.
How big is the difference between European & US companies that have the UN Sustainable Development Goal on Climate Action as an objective?
Answer: European companies are almost 50% more likely to have identified the UN SDG on Climate Action as an objective for their business, with 74% of them committing to this goal, while 25% of US companies have outlined this as a priority, according to ICE's ESG reference data.
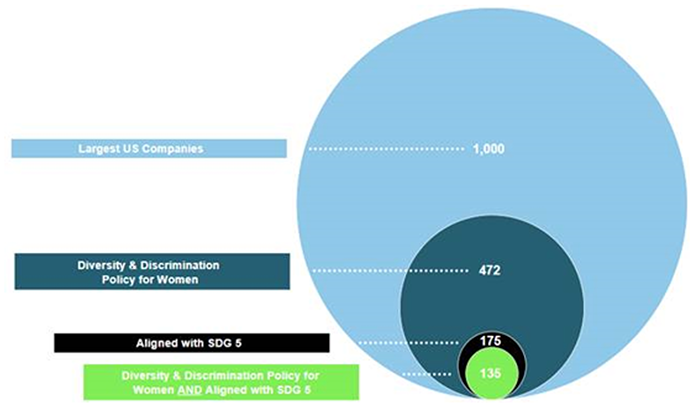
How are the largest 1000 U.S. companies approaching gender equality?
- 472 have diversity and discrimination (D&D) policies for women
- 175 align with the United Nations Sustainable Development Goal (UN SDG) concerning gender equality
- 135 disclose women D&D policies and align with the UN SDG on gender equality
Source: ICE ESG Reference Data
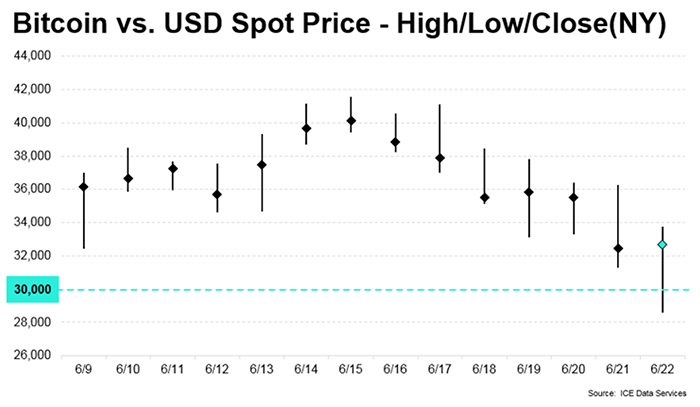
The price of Bitcoin in US dollars briefly dipped below the key 30,000 threshold but managed to bounce back amid increased volatility and higher volumes.
Markets in Focus Newsletter