
Assessing the climate vulnerability of communities across the U.S.
ICE’s Climate Vulnerability Indicator could help identify infrastructure investments that may be impactful.
Authors: ICE Climate Research and Content
A community’s vulnerability to climate-related stressors can depend on more than just physical exposure. In many cases, socioeconomic factors can influence the degree of damage and loss that local communities experience. Hurricane Harvey in Texas (2017) and Hurricane Katrina in Louisiana (2005) disproportionately impacted low-income neighborhoods.1,2 In the wake of Hurricane Sandy, which caused more than $70 billion in damage in 2012, residents in areas with a lower median household income were exposed to more flooding than residents of higher income areas.3
Many other extreme weather events have involved similar disparities in damage, experience, and outcome. A recent study from Stanford University found that in some cases, during periods of drought, low-income households see their water bills rise, while high-income households see their waters bills drop.4 Flooding in the Missouri River Basin in 2019 resulted in nearly $6.2 billion of flood damage across six states and affected more than 14 million people5, with some of most destructive impacts for low-income communities in western Iowa.6 Across dozens of major American cities such as Baltimore and Oakland, lower-income neighborhoods are more likely to have a greater exposure to heat than their wealthier counterparts, often resulting in serious health-related consequences.7
Many states, along with the federal government, are increasingly recognizing the disproportionate toll that extreme weather events can have on low-income communities—as well as the investment needed to mitigate these impacts. At the federal level, the “Justice40 Initiative”8 is directing more investments in climate change infrastructure, housing, and clean energy into socioeconomically vulnerable communities across the country. States like New York and Maine are considering legislation based around similar themes.9,10 Identifying the communities that are most at risk due to both physical climate risk and socioeconomic vulnerability is central to these efforts.
New tool combines two ICE metrics
Over the past year, ICE has developed a Climate Vulnerability Indicator, a tool focused on the intersection of socioeconomic factors and climate risk. The goal of the indicator is to quantify and model the current and future vulnerability of communities across the United States to multiple climate perils.
The methodology behind this new tool lies in the combination of two of ICE’s existing metrics. The first is the ICE Social Impact Score, which combines demographic, socioeconomic, housing, education, employment, and health data from the U.S. Census, the U.S. Bureau of Labor Statistics, and the Centers for Disease Control and Prevention to quantify the socioeconomic vulnerability of a community, town, school district, or any other geographically defined entity. The score ranges from 0 to 100, with 100 indicating the highest socioeconomic vulnerability.
The second set of components of the new Climate Vulnerability Indicator are ICE’s physical climate risk metrics, including value-at-risk estimates for present and future hurricanes, floods, and wildfires, as well as heat and drought projections under the IPCC’s Representative Concentration Pathway 8.5 across the United States out to 2060.
This approach allows us to assess the percentage of the population within any given area that may be vulnerable to climate-related risks today—as well as the percentage of the population that is both at risk today and will likely be exposed to significantly more risk in the future. We refer to these measures of vulnerability as the “percent of the population currently vulnerable” and the “percent of the population that is both currently and future vulnerable.” ICE’s geospatial capabilities allow these Climate Vulnerability Indicators to be assessed for any geographic boundary within the United States.
Affluent and low income communities may often be equally exposed to the climate-related physical risks, but the Climate Vulnerability Indicator is not a measure of physical risk in isolation. It is instead designed to identify communities that are both exposed to high physical climate risks and also socioeconomically vulnerable. These are the communities that may often struggle to secure funding for climate adaptation projects and have more difficulty recovering in the wake of extreme weather events.
Figures 1a and 1b provide a visual description for how the Climate Vulnerability Indicator is constructed for communities across the United States. To assess present-day vulnerability, we find the areas of the country that are socioeconomically vulnerable and at high risk for at least one of these climate-related perils today.
Present Vulnerability
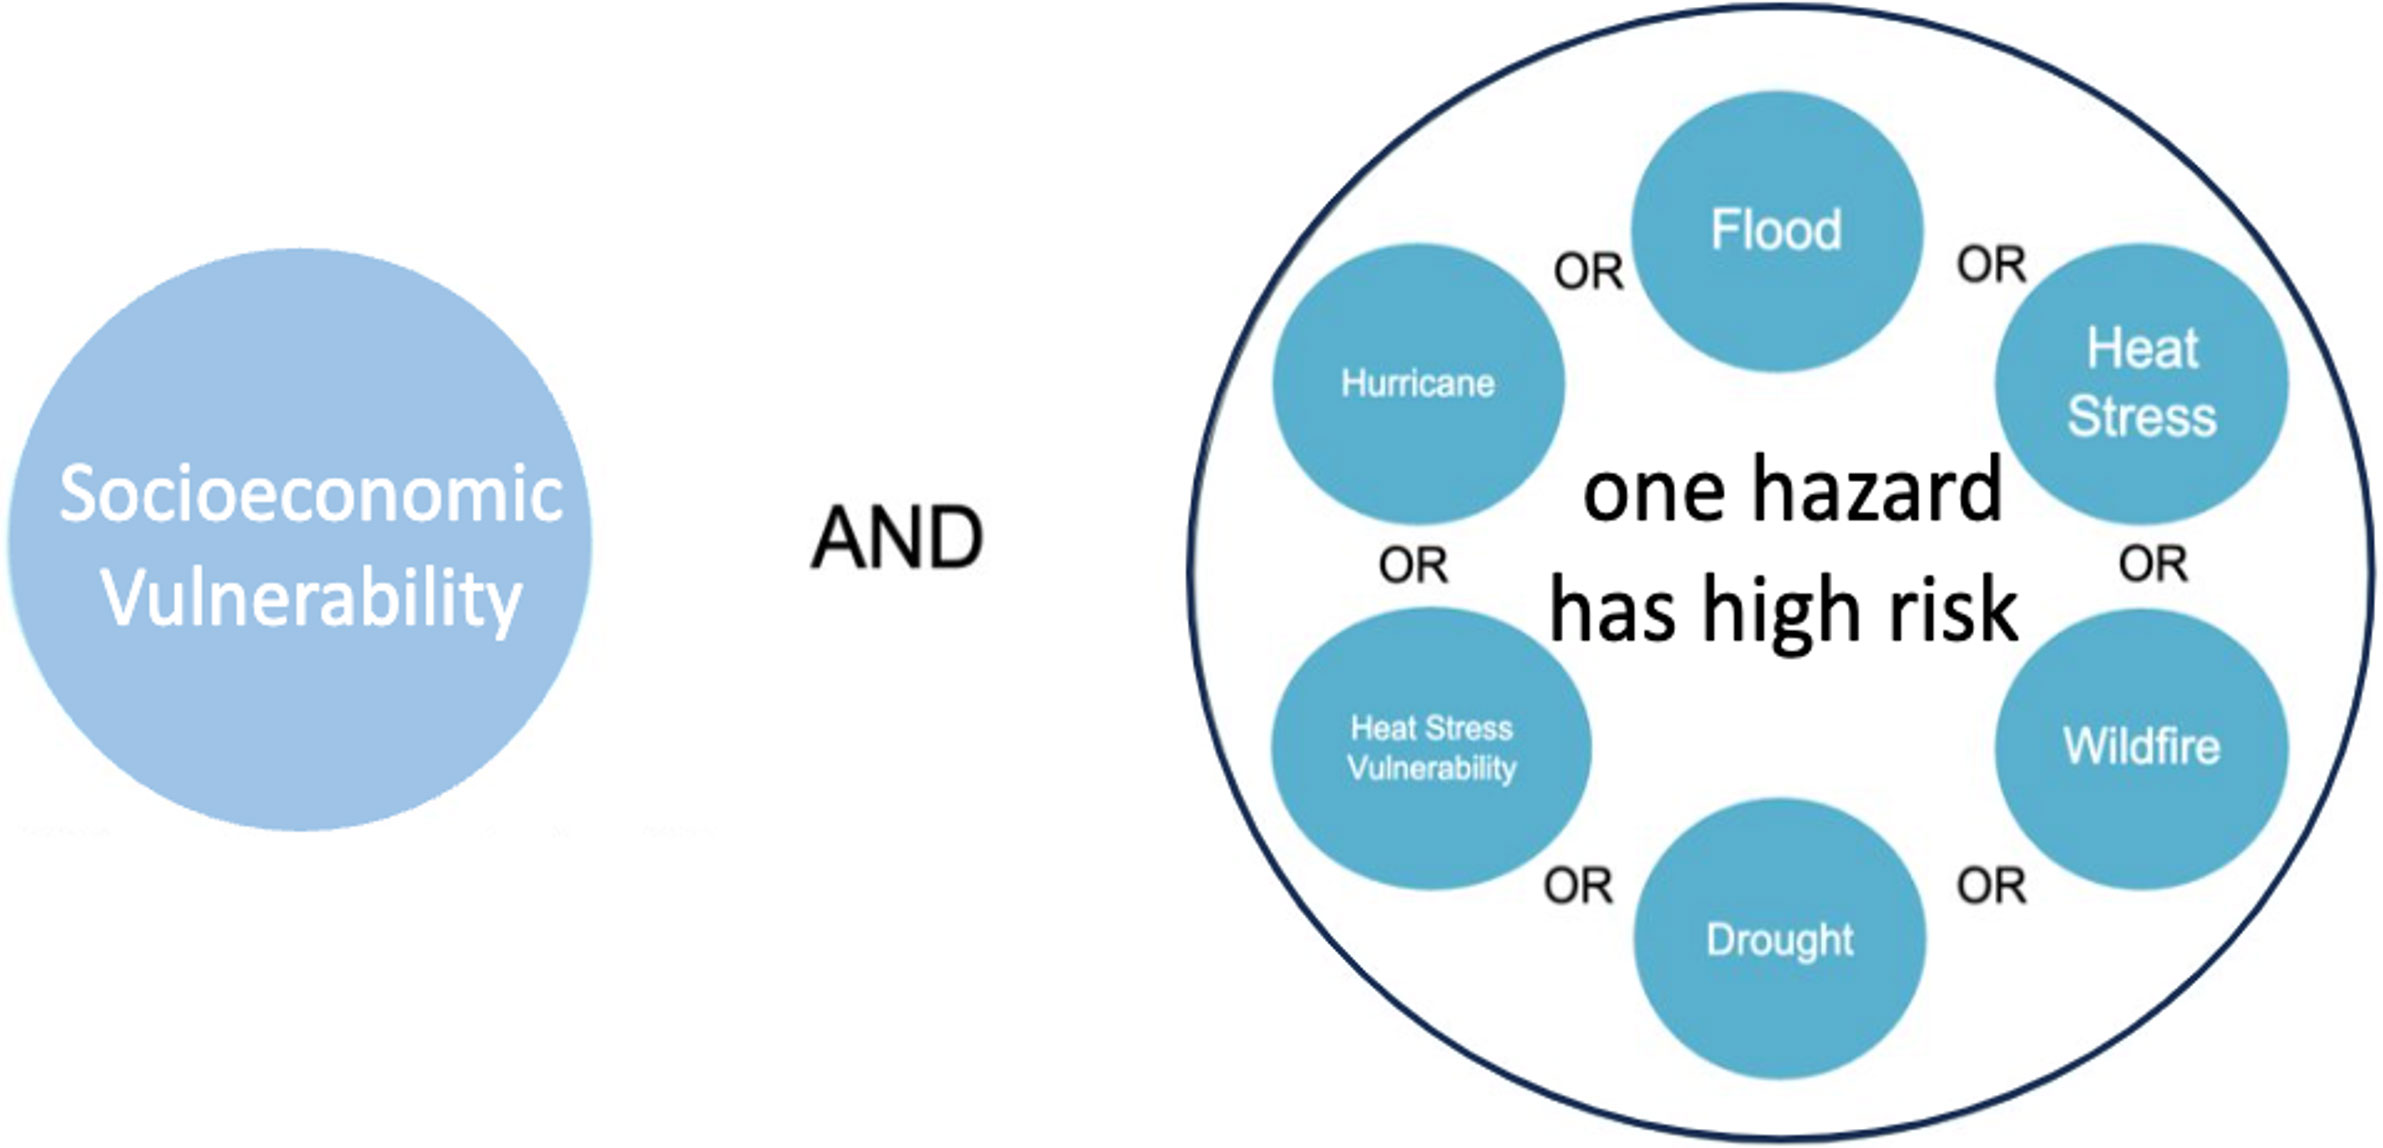
Figure 1a. A schematic illustrating the methodology behind the ICE Climate Vulnerability Indicator for present vulnerability.
We then find the subset of these areas of the country for which the climate-related risks are projected to increase significantly (the top 30th percentile of increasing risk). These areas are designated as climate vulnerable now and in the future.
Future Vulnerability
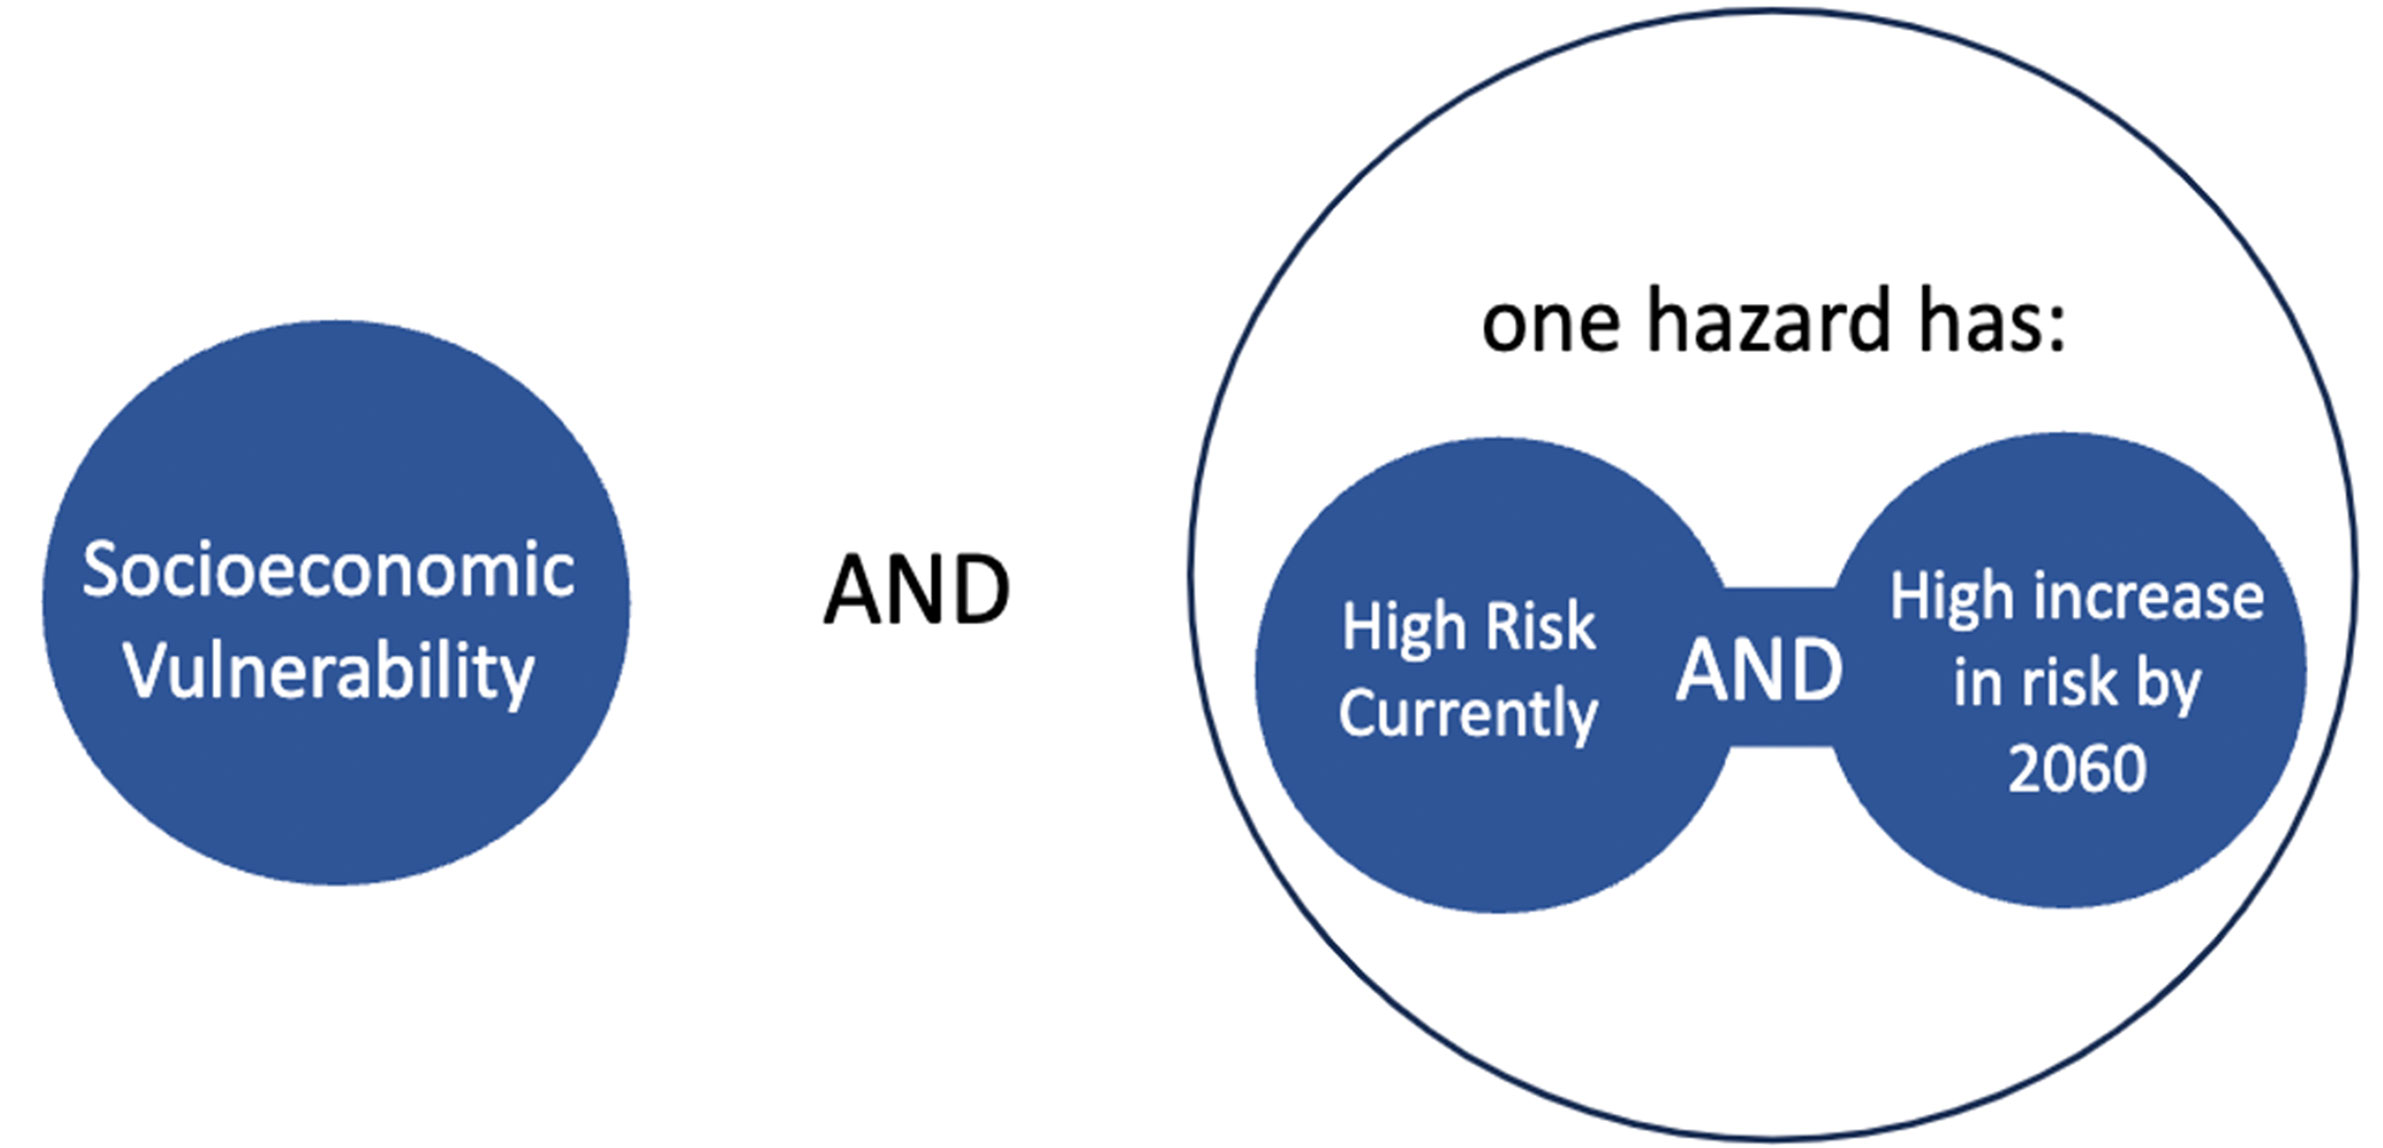
Figure 1b. A schematic illustration of the methodology behind the ICE Climate Vulnerability Indicator for Future Vulnerability.
For the purposes of describing this indicator below, we refer to communities as either “climate vulnerable now” (Figure 1a) or “climate vulnerable now and in the future” (Figure 1b).
Insights
According to the ICE Climate Vulnerability Indicator, California is the state with the largest number of people living in communities with high climate vulnerability now and in the future, with Texas, Florida, and Georgia not far behind (Figure 2). In terms of percentages of the state population, however, Mississippi has the largest percentage of its population living in climate vulnerable areas, followed by Louisiana, Arkansas, Oklahoma, and New Mexico (Figure 3).
Total Vulnerable Population
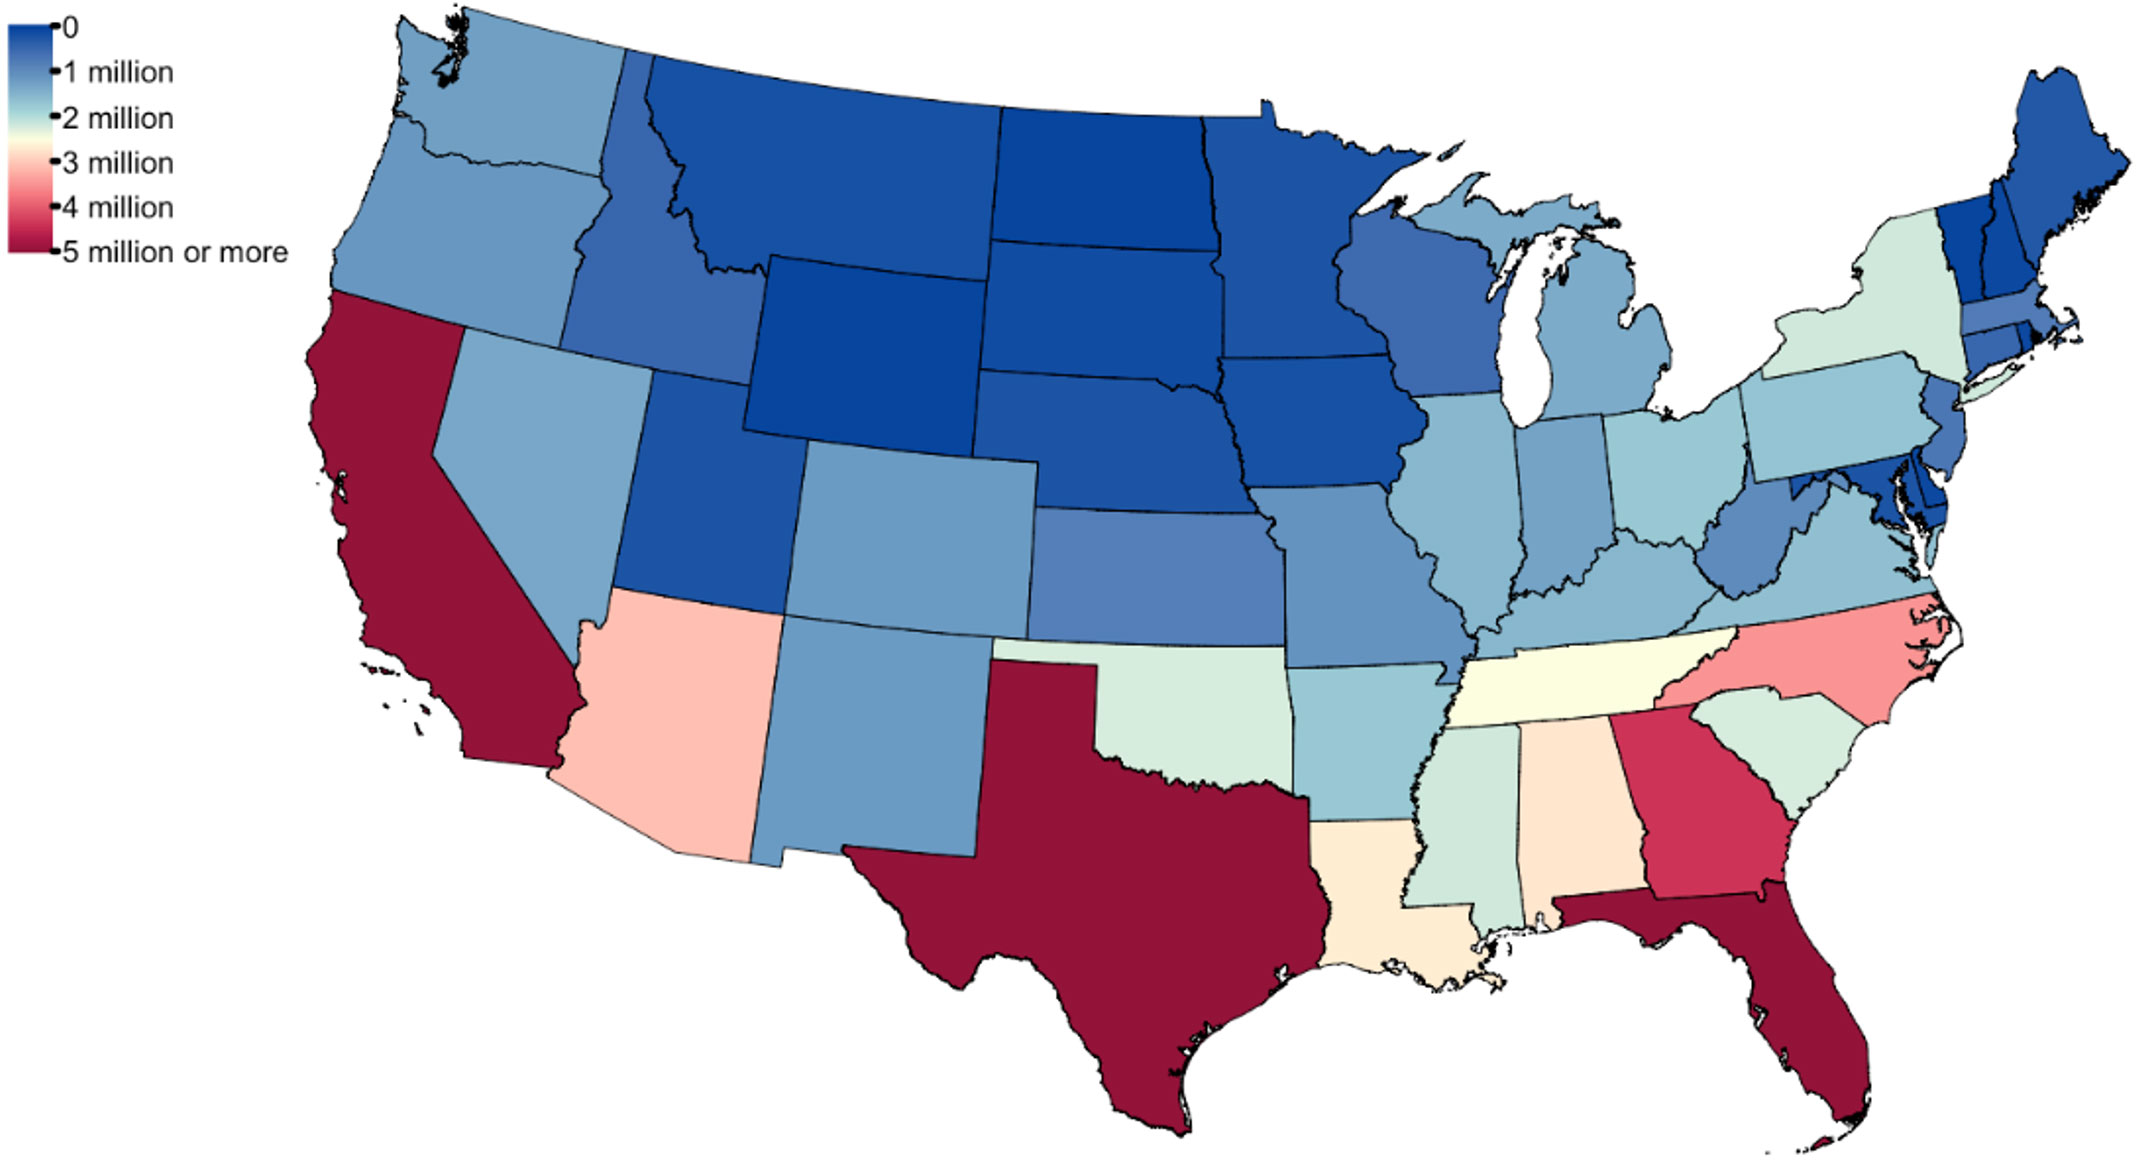
Figure 2. Total population by state in communities with high physical climate risk now or in the future and is socioeconomically vulnerable according to the ICE Climate Vulnerability Indicator. Source: ICE Sustainable Finance as of 6/11/24.
Percent Vulnerable Population
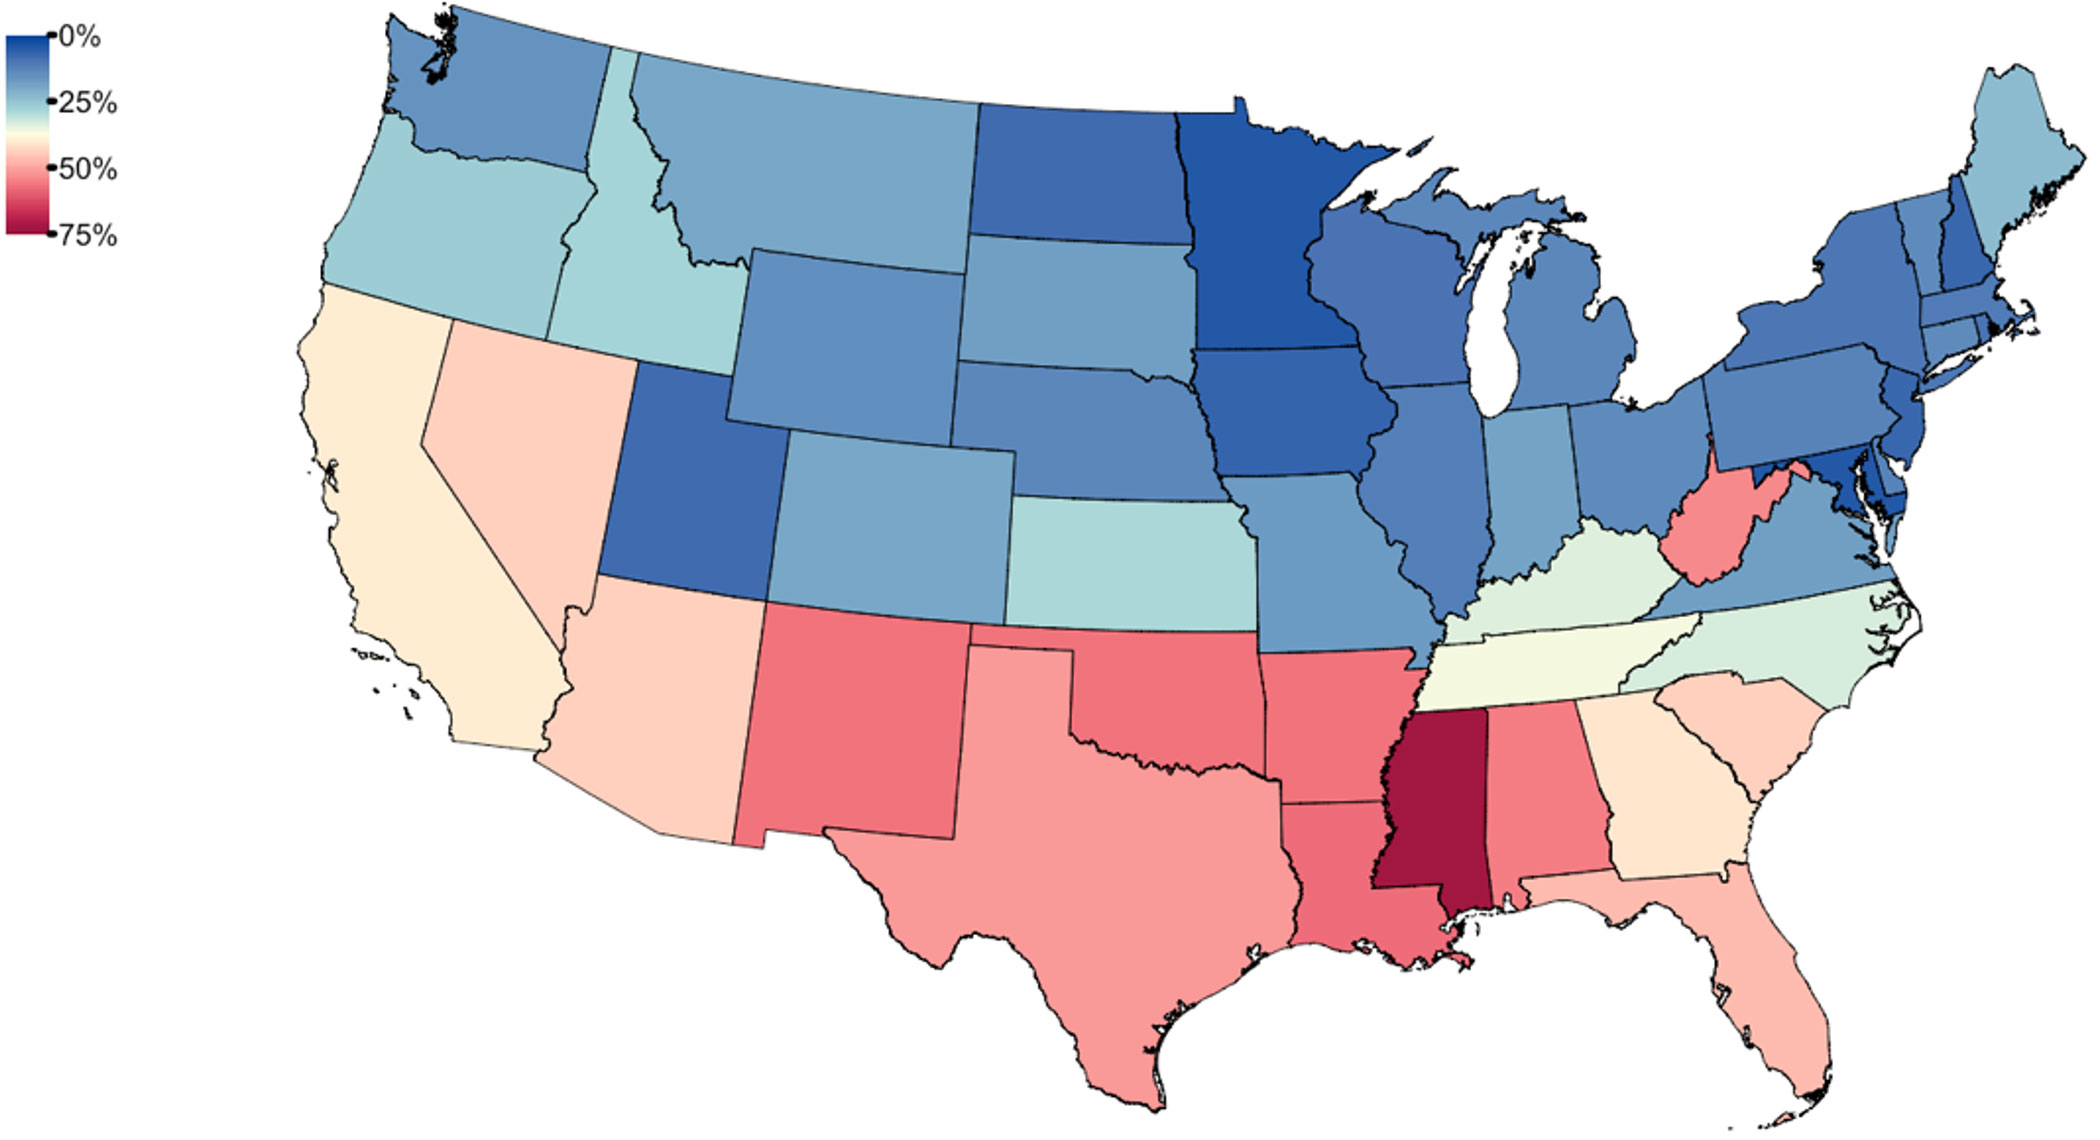
Figure 3. Percent population by state in communities with high physical climate risk now or in the future and is socioeconomically vulnerable according to the ICE Climate Vulnerability Indicator. Source: ICE Sustainable Finance as of 6/11/24.
The ICE Climate Vulnerability Indicator can also inform potential current and future climate vulnerability within smaller areas of the country. Stark socioeconomic differences between neighborhoods within the same city can lead to complex patterns. For example, Harris County, where the city of Houston is located, contains multiple census tracts with high projected current and future vulnerability, especially along the coastline and in east Houston, including cities like Galena Park (Figure 4). By contrast, much of west Houston is relatively affluent. West University Place, a city suburb just south of the Southwest Freeway, has an ICE Social Impact Score of 0.2, making it among the most affluent areas of the country.
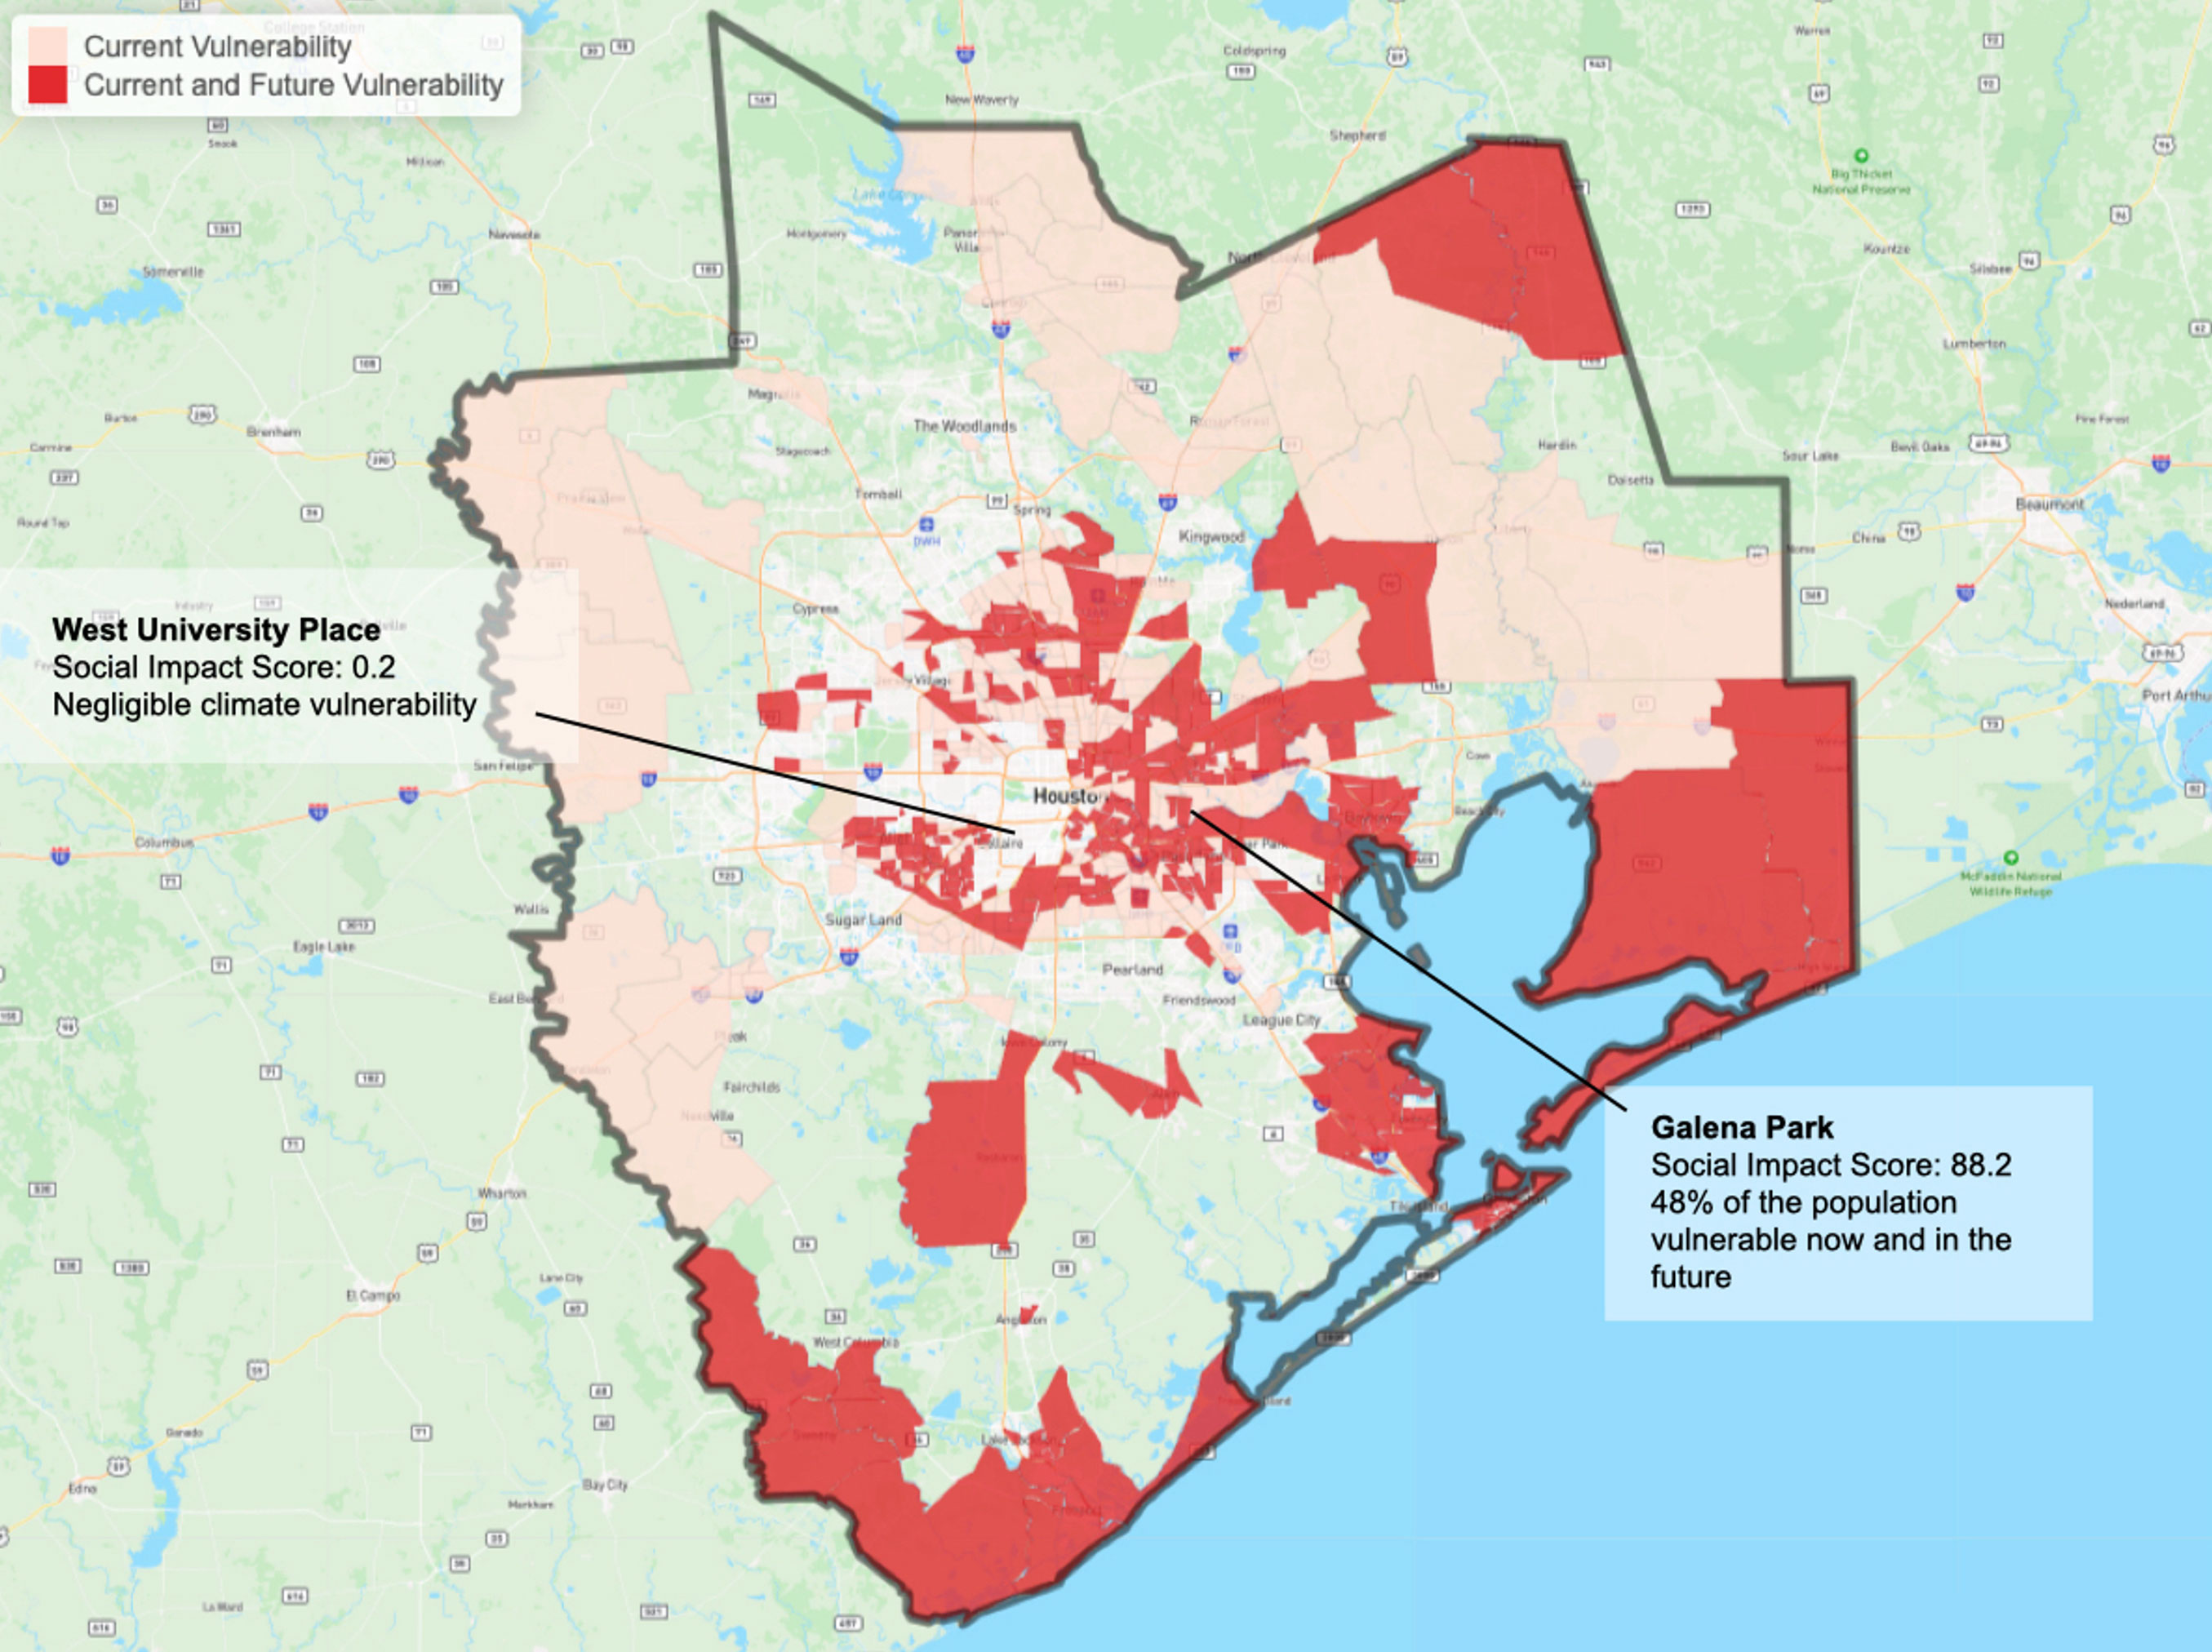
Figure 4. Census tracts that have high current vulnerability or high current and future vulnerability in Harris County, Brazoria County, Fort Bend County, Chambers County, Galveston County, Liberty County, Montgomery County, and Waller County according to the ICE Climate Vulnerability Indicator. The outer boundary of these counties is defined in black. We highlighted the general location of two cities within this boundary. Source: ICE Sustainable Finance as of 6/11/24.
Neighborhoods across Los Angeles also differ in their projected climate vulnerability. North of the city, areas along the coast like Malibu, with both high flood risk and high wildfire risk, are often very affluent (ICE Social Impact Score of 1.8). Other cities in the greater metropolitan area, like Santa Ana, have high climate risk due to perils like drought and heat stress, but higher socioeconomic vulnerability (Figure 5).
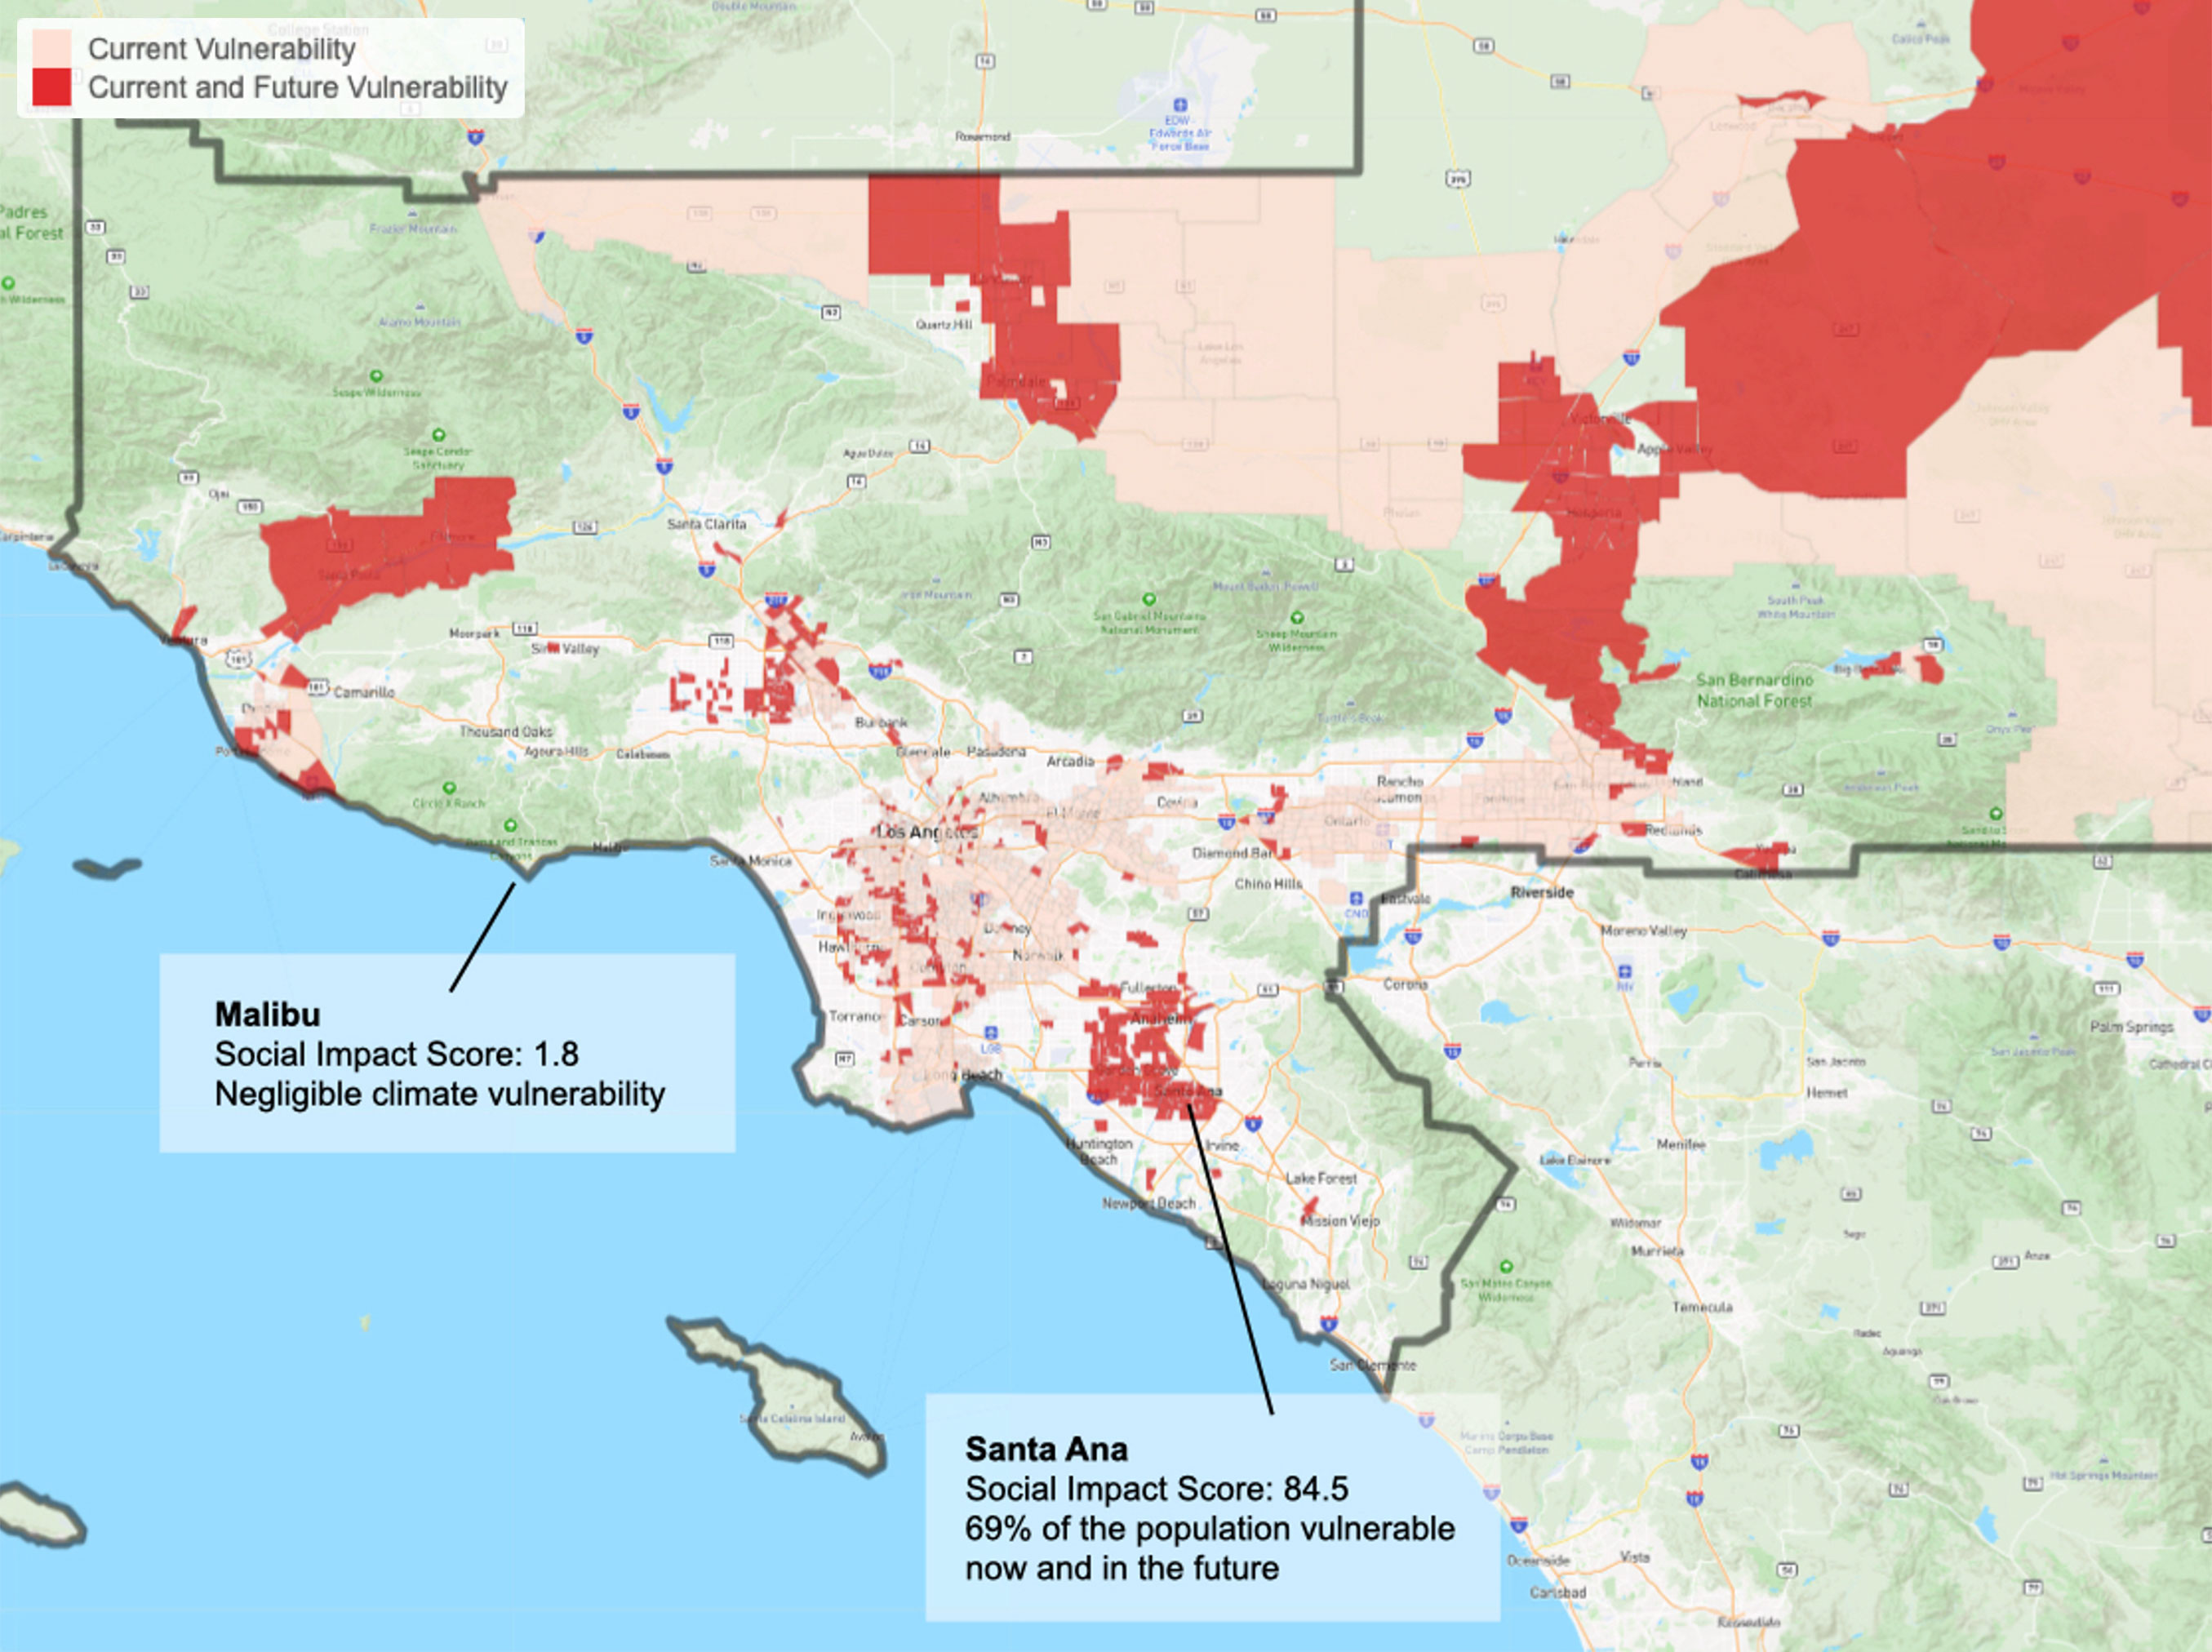
Figure 5. Census tracts that have high current vulnerability or high current and future vulnerability in Los Angeles County, Ventura County, Orange County, and San Bernadino County according to the ICE Climate Vulnerability Indicator. The outer boundary of these counties is defined in black. We highlighted the general location of two cities within this boundary. Source: ICE Sustainable Finance as of 6/11/24.
As the impacts of extreme weather events intensify, many cities, towns, and state governments across the country could face rapidly increasing costs associated with climate adaptation and recovery efforts. Local communities' climate vulnerability will impact these costs as well as the federal, state, and local spending decisions that will have to be made in response.
There are many potential examples of projects that could benefit climate-vulnerable communities. Bonds issued to fund flood mitigation projects in Harris County, where Houston is located, could protect vulnerable neighborhoods like many that flooded in Hurricane Harvey; issuances from school districts in the Midwest and Northeast funding HVAC upgrades and installation could minimize learning disruptions due to excessive heat; and bonds issued to fund water management projects in the Southwest could help increase the water supply for regions experiencing drought. Going forward, the ICE Climate Vulnerability Indicator could help identify these kinds of priority areas and projects.
1Osaka, S. “First-of-its-kind study finds Hurricane Harvey hit Latinos the hardest,” The Washington Post 25 Aug 2022. https://www.washingtonpost.com/climate-environment/2022/08/25/hurricane-harvey-climate-change-study/
2Fussell E, Sastry N, VanLandingham M. “Race, socioeconomic status, and return migration to New Orleans after Hurricane Katrina” Population and Environment 2010 Jan; 31(1-3): 20–42
3Lieberman-Cribbin, W., Gillezeau, C., Schwartz, R. M., & Taioli, E. (2021). Unequal social vulnerability to Hurricane Sandy flood exposure. Journal of exposure science & environmental epidemiology, 31(5), 804–809. https://doi.org/10.1038/s41370-020-0230-6
4Castañón, L. (2023, January 17). Droughts Increase Costs for Low-Income Households. Stanford University School of Engineering. https://engineering.stanford.edu/magazine/droughts-increase-costs-low-income-households
5Reed, T., Mason, L. R., & Ekenga, C. C. (2020). Adapting to Climate Change in the Upper Mississippi River Basin: Exploring Stakeholder Perspectives on River System Management and Flood Risk Reduction. Environmental health insights, 14, 1178630220984153. https://doi.org/10.1177/1178630220984153
6Peikes K. “Report: Flooding Takes A Bigger Toll On Poor Communities,” IPR News 13 Dec 2019. https://www.iowapublicradio.org/ipr-news/2019-12-13/report-flooding-takes-a-bigger-toll-on-poor-communities
7Anderson, M., & McMinn, S. (2019, September 3). As Rising Heat Bakes U.S. Cities, the Poor Often Feel It Most. NPR. https://www.npr.org/2019/09/03/754044732/as-rising-heat-bakes-u-s-cities-the-poor-often-feel-it-most
8The United States Government. (2024, February 28). Justice40 Initiative. The White House. https://www.whitehouse.gov/environmentaljustice/justice40/
9Climate Act: New York’s Scoping Plan. NY.gov. (n.d.). https://climate.ny.gov/resources/scoping-plan
10Maine’s Application to the U.S. EPA Climate Pollution Reduction Implementation Grant: Accelerating Maine Won’t Wait greenhouse gas reduction strategies. Maine.gov. (2024, March 8). https://www.maine.gov/future/sites/maine.gov.future/files/2024-03/CPRG%20straw%20proposal%203_1_24.pdf
Explore our solutions
Quantifying climate risk and opportunities in fixed income and real estate.