
In recent years, flooding in California has led to catastrophic damage across the state, destroying homes, businesses, and other essential infrastructure. Between December 2022 and March 2023, this flooding resulted in an estimated $4.6 billion in damages and 22 deaths.1 Most recently, in March, an atmospheric river storm system left around 350,000 utility customers across the state without power. This same storm caused a 74-year-old levee on the Pajaro River in Central California to fail, submerging a town and forcing thousands of residents to evacuate. A New York Times article noted that the river’s water infrastructure was outdated at least partially because property values in the area were low.2 Cost-benefit analyses conducted by the Federal Emergency Management Agency and the U.S. Army Corps of Engineers often do not prioritize protecting areas with fewer economic assets at risk.3,4,5 As a result, socioeconomically vulnerable communities like Pajaro may be left more exposed to flood risk than other nearby communities.
California’s recent flooding has been largely caused by atmospheric rivers which are, according to the National Oceanic and Atmospheric Administration (“NOAA”), “flowing columns of condensed water vapor in the atmosphere responsible for producing significant levels of rain and snow, especially in the Western U.S.”6 Two years earlier, in January 2021, another atmospheric river caused an estimated $1.3 billion in damages and led to flooding and mudslides in areas already impacted by wildfires in 2020.7 According to ICE climate models, the value at risk across California from inland flooding is projected to continue increasing; by 2050, the expected GDP impairment across the state is over 13% and the property value at risk is projected to be over 3.5%.
As the impacts of climate change worsen, the state faces increasing pressure to step in with funds to help communities like Pajaro prepare and adapt. In March of 2024, California voters may be able to decide whether the state will issue a $15.5 billion general obligation “Climate Resiliency Bond.” The bond proposal needs to be approved by both houses and signed by the Governor to appear on the ballot in 2024. The proposal has already passed in the Senate with bipartisan support.8 The proposed bill notes that $5.2 billion will be allocated towards drought, flood, and water resilience programs, with several mentions that a portion of these projects must benefit ‘disadvantaged communities’ – defined by the bill to be communities “with a median household income of less than 80 percent of the area average.”9
Click image to enlarge
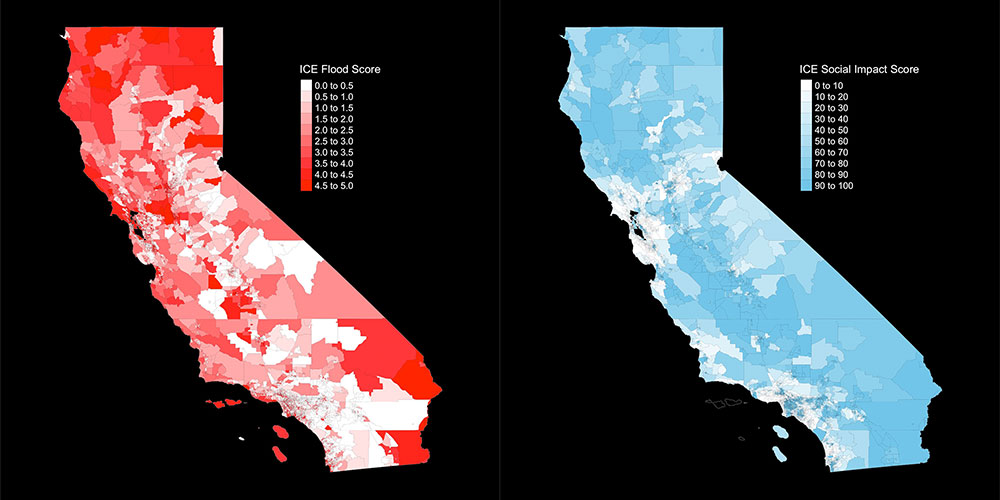
Figure 1. ICE Flood Risk Scores (left) and ICE Social Impact Scores, a measure of socioeconomic vulnerability, (right) by census tract across California. (Source: ICE Sustainable Finance as of 08/14/2023)
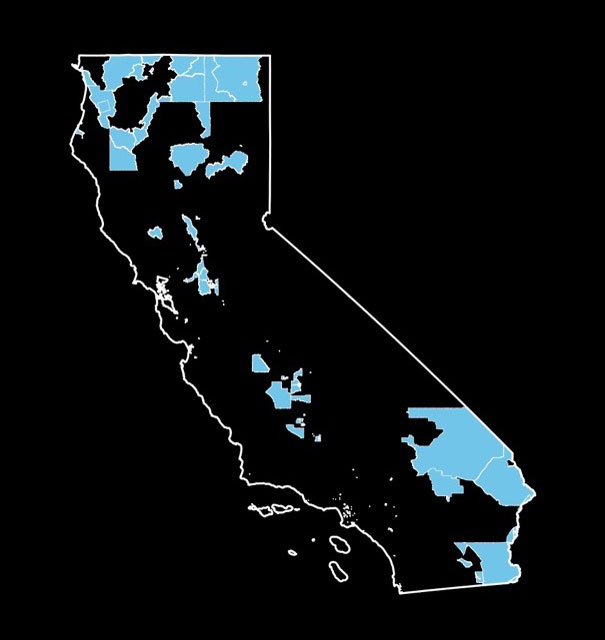
Figure 2. Census tracts across California that have both ICE Flood Risk Scores > 3.5 and ICE Social Impact Scores > 75. (Source: ICE Sustainable Finance as of 08/14/2023)
Figure 3. Animation of projected property value at risk from inland flooding by census tract across California under the IPCC’s RCP8.5 emissions scenario from 2023-2060. (Source: ICE Sustainable Finance as of 08/31/2023)
ICE data and models can help shed light on the flood risk and social vulnerability of many of the communities highlighted in this bill – and some that are missing. While the bond proposal characterizes a disadvantaged community using median income, ICE Social Impact Scores represent a more holistic measure of the socioeconomic vulnerability of a community, incorporating information about demographics, health, employment, and income. The score ranges between 0 and 100, where a higher score indicates a more socioeconomically vulnerable community. ICE Flood Risk Scores quantify the flood risk of communities on a scale of 0 to 5, with an increase of 1 representing an approximate doubling of risk. From both a socioeconomic and climate perspective, here are two areas in California that may be particularly vulnerable, with ICE Flood Risk Scores > 3.5 and ICE Social Impact Scores > 75:
- The Sacramento-San Joaquin Delta and the San Joaquin River are mentioned several times in the bond proposal, signifying an urgency to mitigate the flood risk of this area. Located at the mouth of the San Joaquin River, the city of Stockton serves as a powerful illustration of how socioeconomic factors can compound or mitigate the impacts of flooding. According to the director of the San Joaquin Area Flood Control Agency, Stockton, a city of more than 300,000, has one of the lowest levels of flood protection in comparison to other major river cities in the United States.10 With an ICE Social Impact Score of 89 and an ICE Flood Risk Score of 4, an increase in flooding without additional infrastructure in place could have a devastating impact on a vulnerable community.
- There are also communities across the state with very high flood risk and high social vulnerability that are not explicitly mentioned in the bill. For example, many desert areas in southeastern California are both drought-prone and exposed to extremely high flood risk – an interesting duality of physical risk exposure. Located within this region is Mojave National Preserve, a tourist destination which was forced to shut down twice in August 2022 due to an increase in flash flooding that wiped out roads, buried cars in sediment, and stranded over 1,000 people in the park. The Mojave Desert is one of the hottest and driest places on earth, and typically averages around two total inches of rainfall a year.11 However as temperatures rise, warmer atmospheres can “hold” more water vapor, increasing the amount of rainfall when conditions for heavy precipitation events occur.12 The city of Needles, which has an ICE Social Impact Score of 77 and an ICE Flood Risk Score of 4.1, is also located in this region. ICE drought models project that by 2030, the city will be in the 94th percentile for drought risk under the Intergovernmental Panel on Climate Change’s very high baseline emissions scenario, Representative Concentration Pathway 8.5 (RCP8.5).
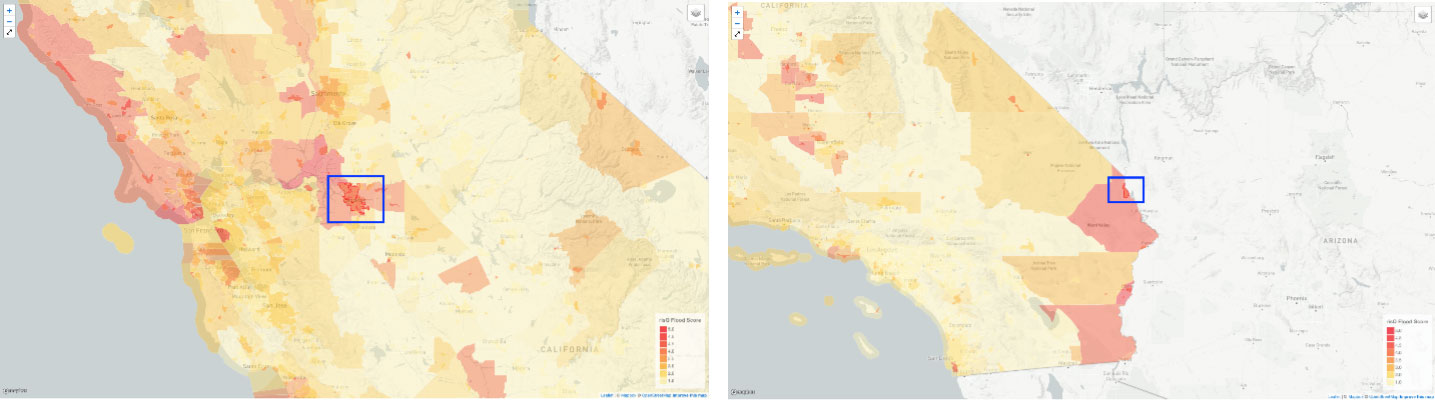
Figure 4. Locations and ICE Flood Risk Scores associated with the city of Stockton (left) and the city of Needles (right). (Source: ICE Sustainable Finance as of 08/14/2023)
For municipal bond market participants interested in the intersection of social vulnerability and climate exposure, previous research by ICE has shown that lower income communities generally have less access to debt capital. Combined with the fact that federal flood mitigation infrastructure efforts tend to be concentrated in areas with high property values, this bond proposal represents an opportunity to provide flood mitigation-related funding to less affluent communities— communities like Pajaro, Stockton, and Needles—that may stand to benefit the most from investment.13
1NOAA National Centers for Environmental Information (NCEI) U.S. Billion-Dollar Weather and Climate Disasters (2023). Retrieved from https://www.ncei.noaa.gov/access/billions/, DOI: 10.25921/stkw-7w73
2Arango, T., & Hubler, S. (2023, March 15). California levee failures mount as storms continue relentless drive. The New York Times. Retrieved from https://www.nytimes.com/2023/03/14/us/california-storm-pajaro-levee.html
3Loeb, Penny. (April 29, 2021). Too Poor to Protect: When Cost-Benefit Analysis leaves towns to “Wash Away.” The Daily Yonder. https://dailyyonder.com/too-poor-to-protect-when-cost-benefit-analysis-leaves-towns-to-wash-away/2021/04/29/
4McGee, K. (2021) A Place worth Protecting: Rethinking Cost-Benefit Analysis under FEMA’s Flood Mitigation Programs. The University of Chicago Law Review, 88(8), 1925-1970.
5Arango, T., & Hubler, S. (2023)
6NOAA Physical Sciences Laboratory (PSL) Atmospheric River Portal: “About ARs” (2023), Retrieved from: https://psl.noaa.gov/arportal/about/. Accessed 8/15/23.
7NOAA National Centers for Environmental Information (NCEI) U.S. Billion-Dollar Weather and Climate Disasters (2023). Retrieved from https://www.ncei.noaa.gov/access/billions/, DOI: 10.25921/stkw-7w73
8Vankin, J. (2023, June 27). $15.5 Billion “Climate Resiliency Bond” Getting Ready for Voters on 2024 Ballot. California Local. Retrieved from https://californialocal.com/localnews/statewide/ca/article/show/44564-climate-change-bond-california/
9Bill Text - SB-867 Drought, Flood, and Water Resilience, Wildfire and Forest Resilience, Coastal Resilience, Extreme Heat Mitigation, Biodiversity and Nature-Based Climate Solutions, Climate Smart Agriculture, Park Creation and Outdoor Access, and Clean Energy Bond Act of 2024. (n.d.). https://leginfo.legislature.ca.gov/faces/billTextClient.xhtml?bill_id=202320240SB867
10Porras, G. (2023, March 15). Flood Control official: San Joaquin River flooding could cause billions in damage, hundreds of deaths in next 50 years. abc10.com. Retrieved August 15, 2023, from https://www.abc10.com/article/news/local/san-joaquin-river-flooding-concerns-future/103-511d1866-3f66-4bc7-b2f9-485a2ad788a9
11Scott, V. (2022, August 29). Mojave National Preserve is closed again for massive flash floods that wiped out roads. The Drive. https://www.thedrive.com/news/mojave-national-preserve-is-closed-again-for-massive-flash-floods-that-wiped-out-roads
12USGCRP Indicator Details. GlobalChange.gov. Retrieved August 15, 2023, from https://www.globalchange.gov/browse/indicators/heavy-precipitation
13McGee, K. (2021)
Limitations
This document contains information that is proprietary property of Intercontinental Exchange, Inc. and its affiliates (“ICE Group”) and is not to be published, reproduced, copied, disclosed or used without the express written consent of ICE Group.
This document is provided for informational purposes only. Nothing herein should in any way be deemed to alter the legal rights and obligations contained in agreements between ICE Group and its clients relating to any of the products or services described herein. Nothing herein is intended to constitute legal, tax, accounting or other professional advice.
The information contained herein is provided “as is.” ICE makes no warranties whatsoever, either express or implied, as to merchantability, fitness for a particular purpose, or any other matter. Without limiting the foregoing, ICE Group makes no representation or warranty that any data or information (including but not limited to evaluations) supplied to or by it are complete or free from errors, omissions, or defects.
All values included in the products and services described herein are estimates, including those values that are derived using data provided by other data providers as well as forecasts of expectations of change. Such estimates are based upon information available to ICE Group at the time of calculation, are provided as is, and should be treated as estimates and forecasts with potentially substantial deviations from actual outcomes, regardless of whether such features are explicitly described in any data dictionary, methodology, or definition as estimates or forecasts.
ICE Group is not registered as a nationally registered statistical rating organizations, nor should this document be construed to constitute an assessment of the creditworthiness of any company or financial instrument. Analytics available from ICE Group should not be considered an analyst’s opinion of the underlying investability of a particular location or security. No part of this service should be construed as providing investment advice.
Trademarks of Intercontinental Exchange, Inc. and/or its affiliates include: Intercontinental Exchange, ICE, ICE block design, NYSE, ICE Data Services, ICE Data and New York Stock Exchange. Information regarding additional trademarks and intellectual property rights of Intercontinental Exchange, Inc. and/or its affiliates is located at www.intercontinentalexchange.com/terms-of-use. Other products, services, or company names mentioned herein are the property of, and may be the service mark or trademark of, their respective owners.
© 2023 Intercontinental Exchange, Inc.