
May 2025
ICE Climate’s new physical risk datasets provide a global, portfolio-wide view of risk exposure across corporate and sovereign asset classes.
- As climate risks become more material in financial markets, investors can use next-generation global datasets from ICE Climate to factor these risks into investment decisions.
- ICE Climate has expanded its geospatial platform to introduce global physical risk for corporates and sovereigns. Our data can be applied to quantify risks for a multitude of use cases, whether climate hazards pertain to global corporations and their assets, individual homes within mortgage pools and real estate portfolios, or buildings situated within a specific municipality or local authority.
- In this article, we showcase how ICE Climate’s physical risk datasets incorporate information from ~1.6 billion building footprints worldwide.
- The granularity of this data enables ICE Climate to aggregate and assess climate risks consistently, anywhere in the world and provide a portfolio-wide view of risk exposure across asset classes.

When it comes to flood risk, location matters. Take the maps of flood risks in areas near Bangkok, Thailand, Alexandria, Egypt, Koto City, Japan, and Zermatt, Switzerland (Figure 1). Some homes and buildings in these areas are projected to experience annual average losses (as a percentage of property value) of over 0.6% due to rain-related flooding by 2050, while other buildings in the same neighborhoods are projected to be at much lower risk.
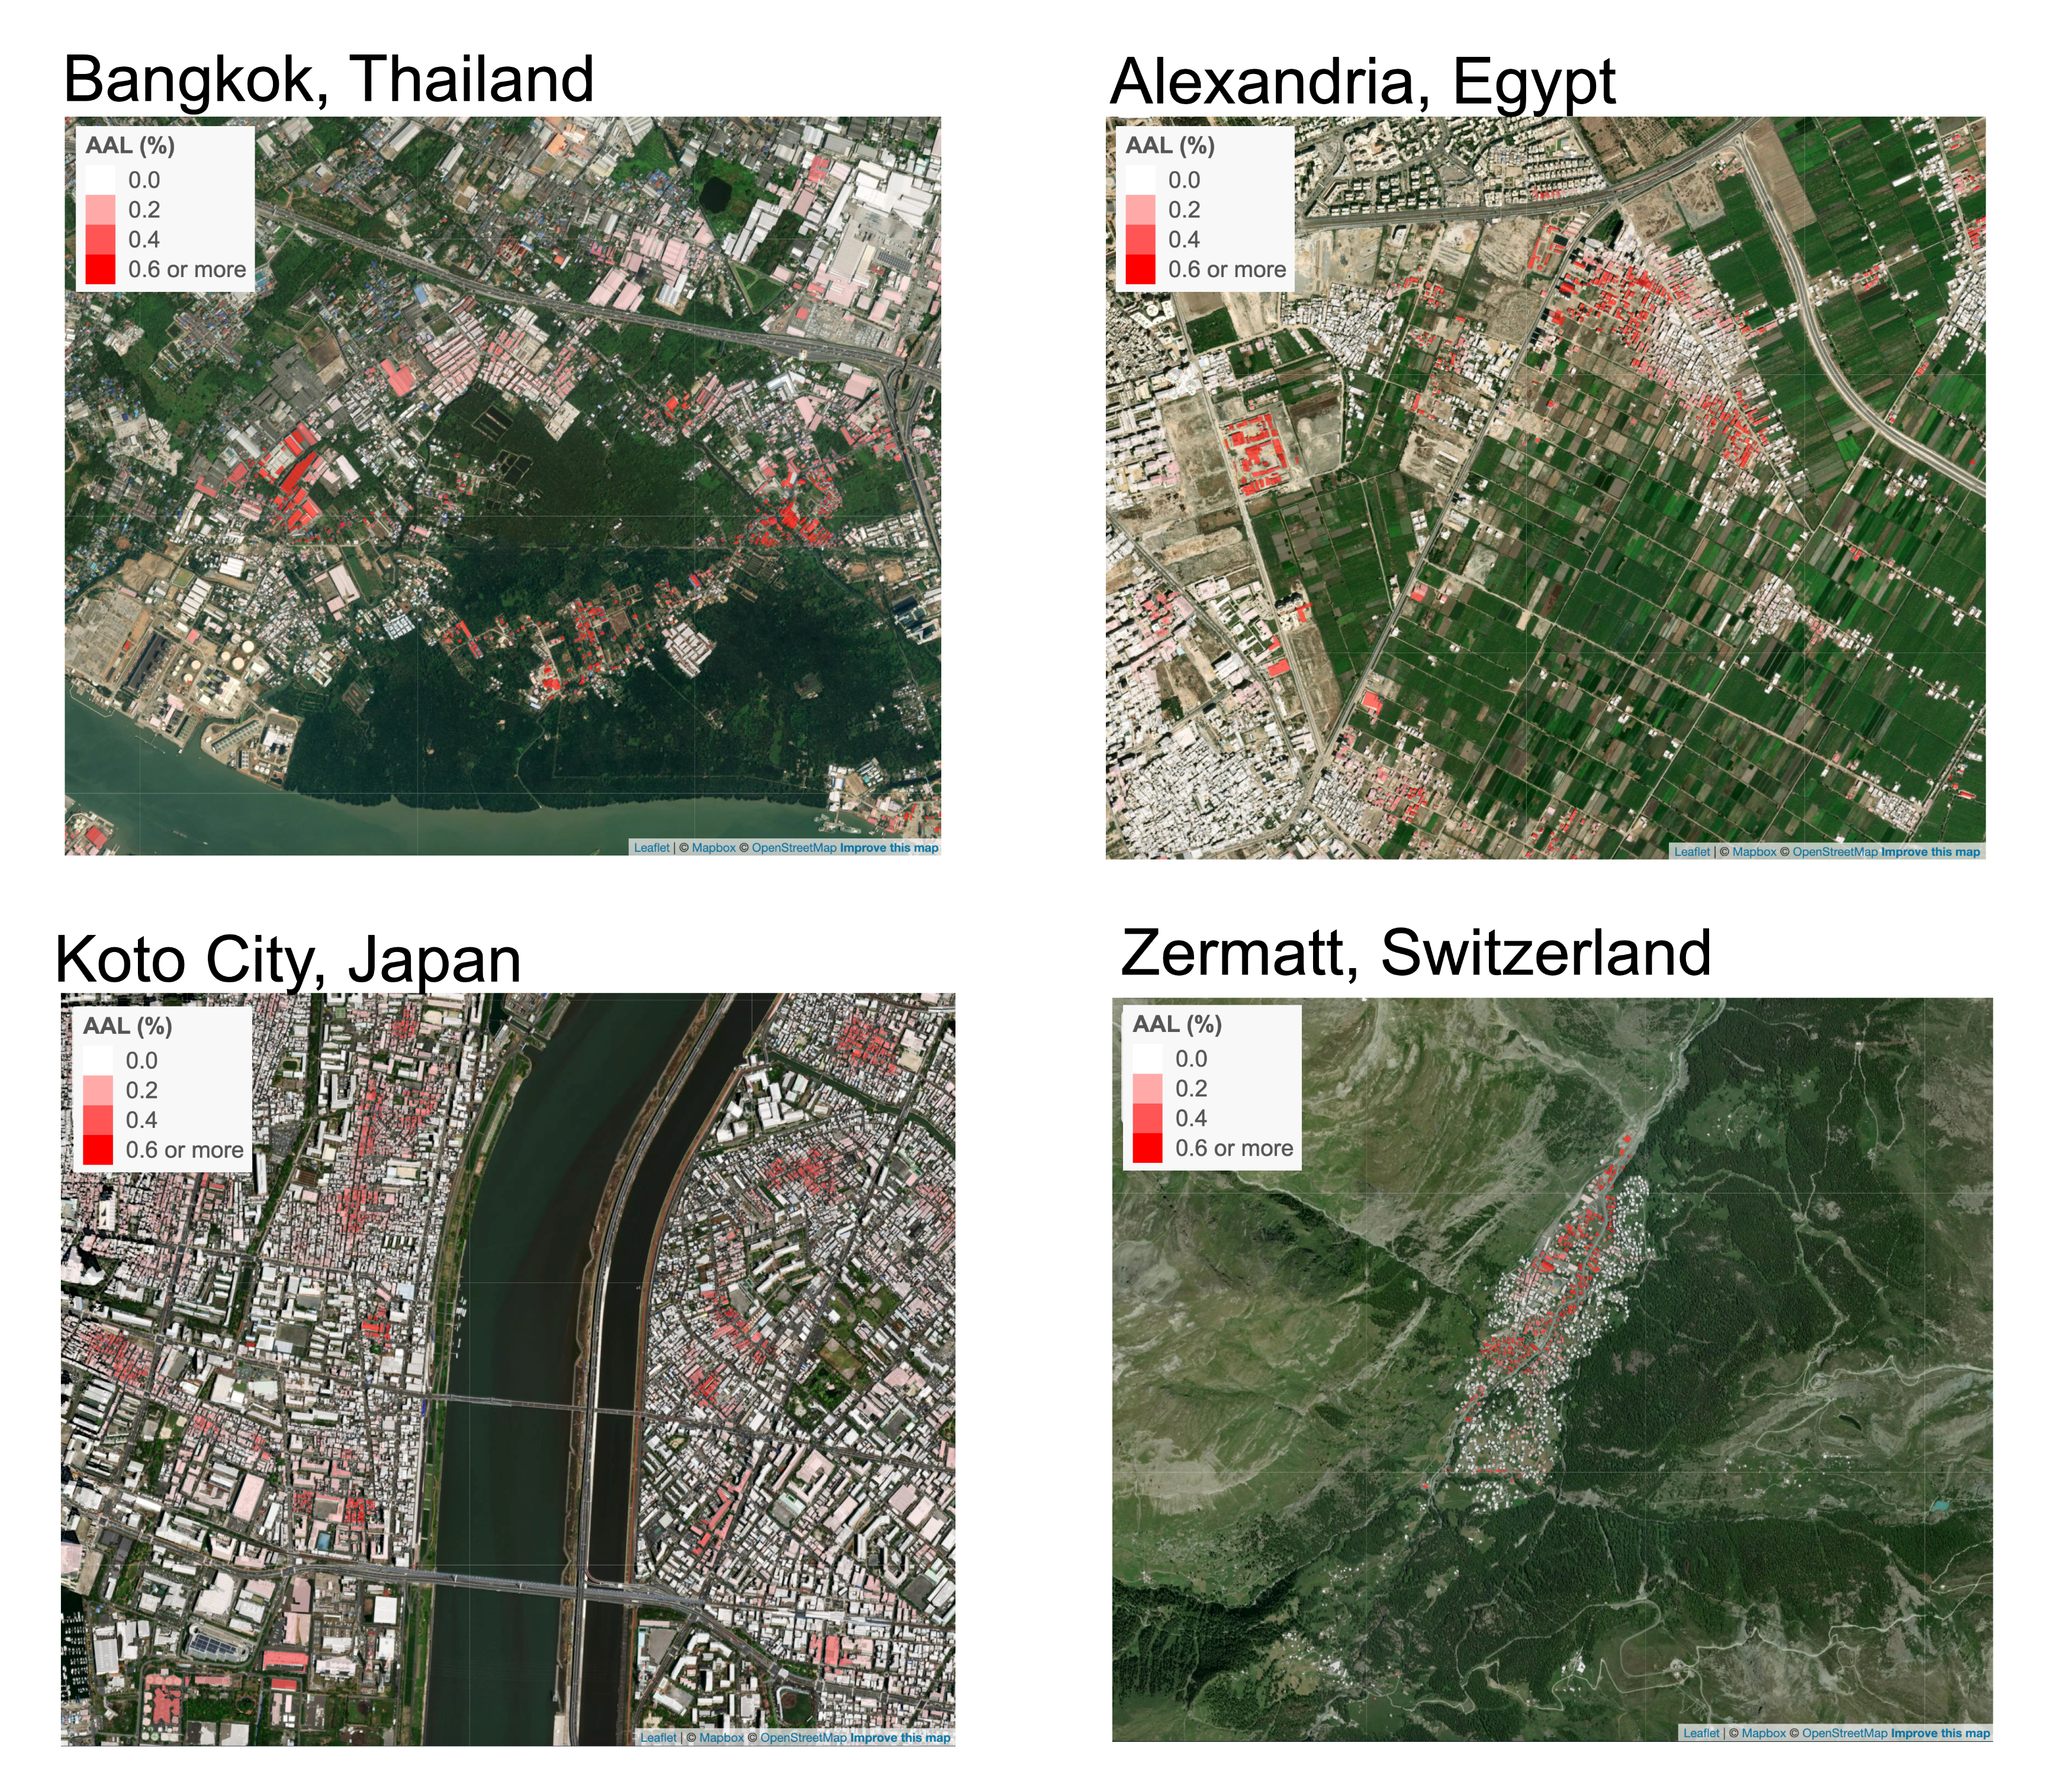
Figure 1. Views of the greater Bangkok, Thailand, Alexandria, Egypt, Koto City, Japan, and Zermatt, Switzerland areas, with building footprints shaded by projected rain-related flood risk (measured as annual average percentage losses) under Shared Socioeconomic Pathway 5-8.5 in 2050. Source: ICE as of 04/08/2025. Contains information from GlobalMLBuildingFootprints,1 which is made available here under the Open Database License (ODbL).

In the United States, in the port city of Norfolk, Virginia, many neighborhoods face similar risks due to coastal flooding (Figure 2). Time is an additional factor that must be considered when comprehensively assessing climate risk. In the case of Norfolk, by 2050, the location, shape, size or orientation of a home, warehouse or mall, could mean the difference between a usable building and an unusable one.
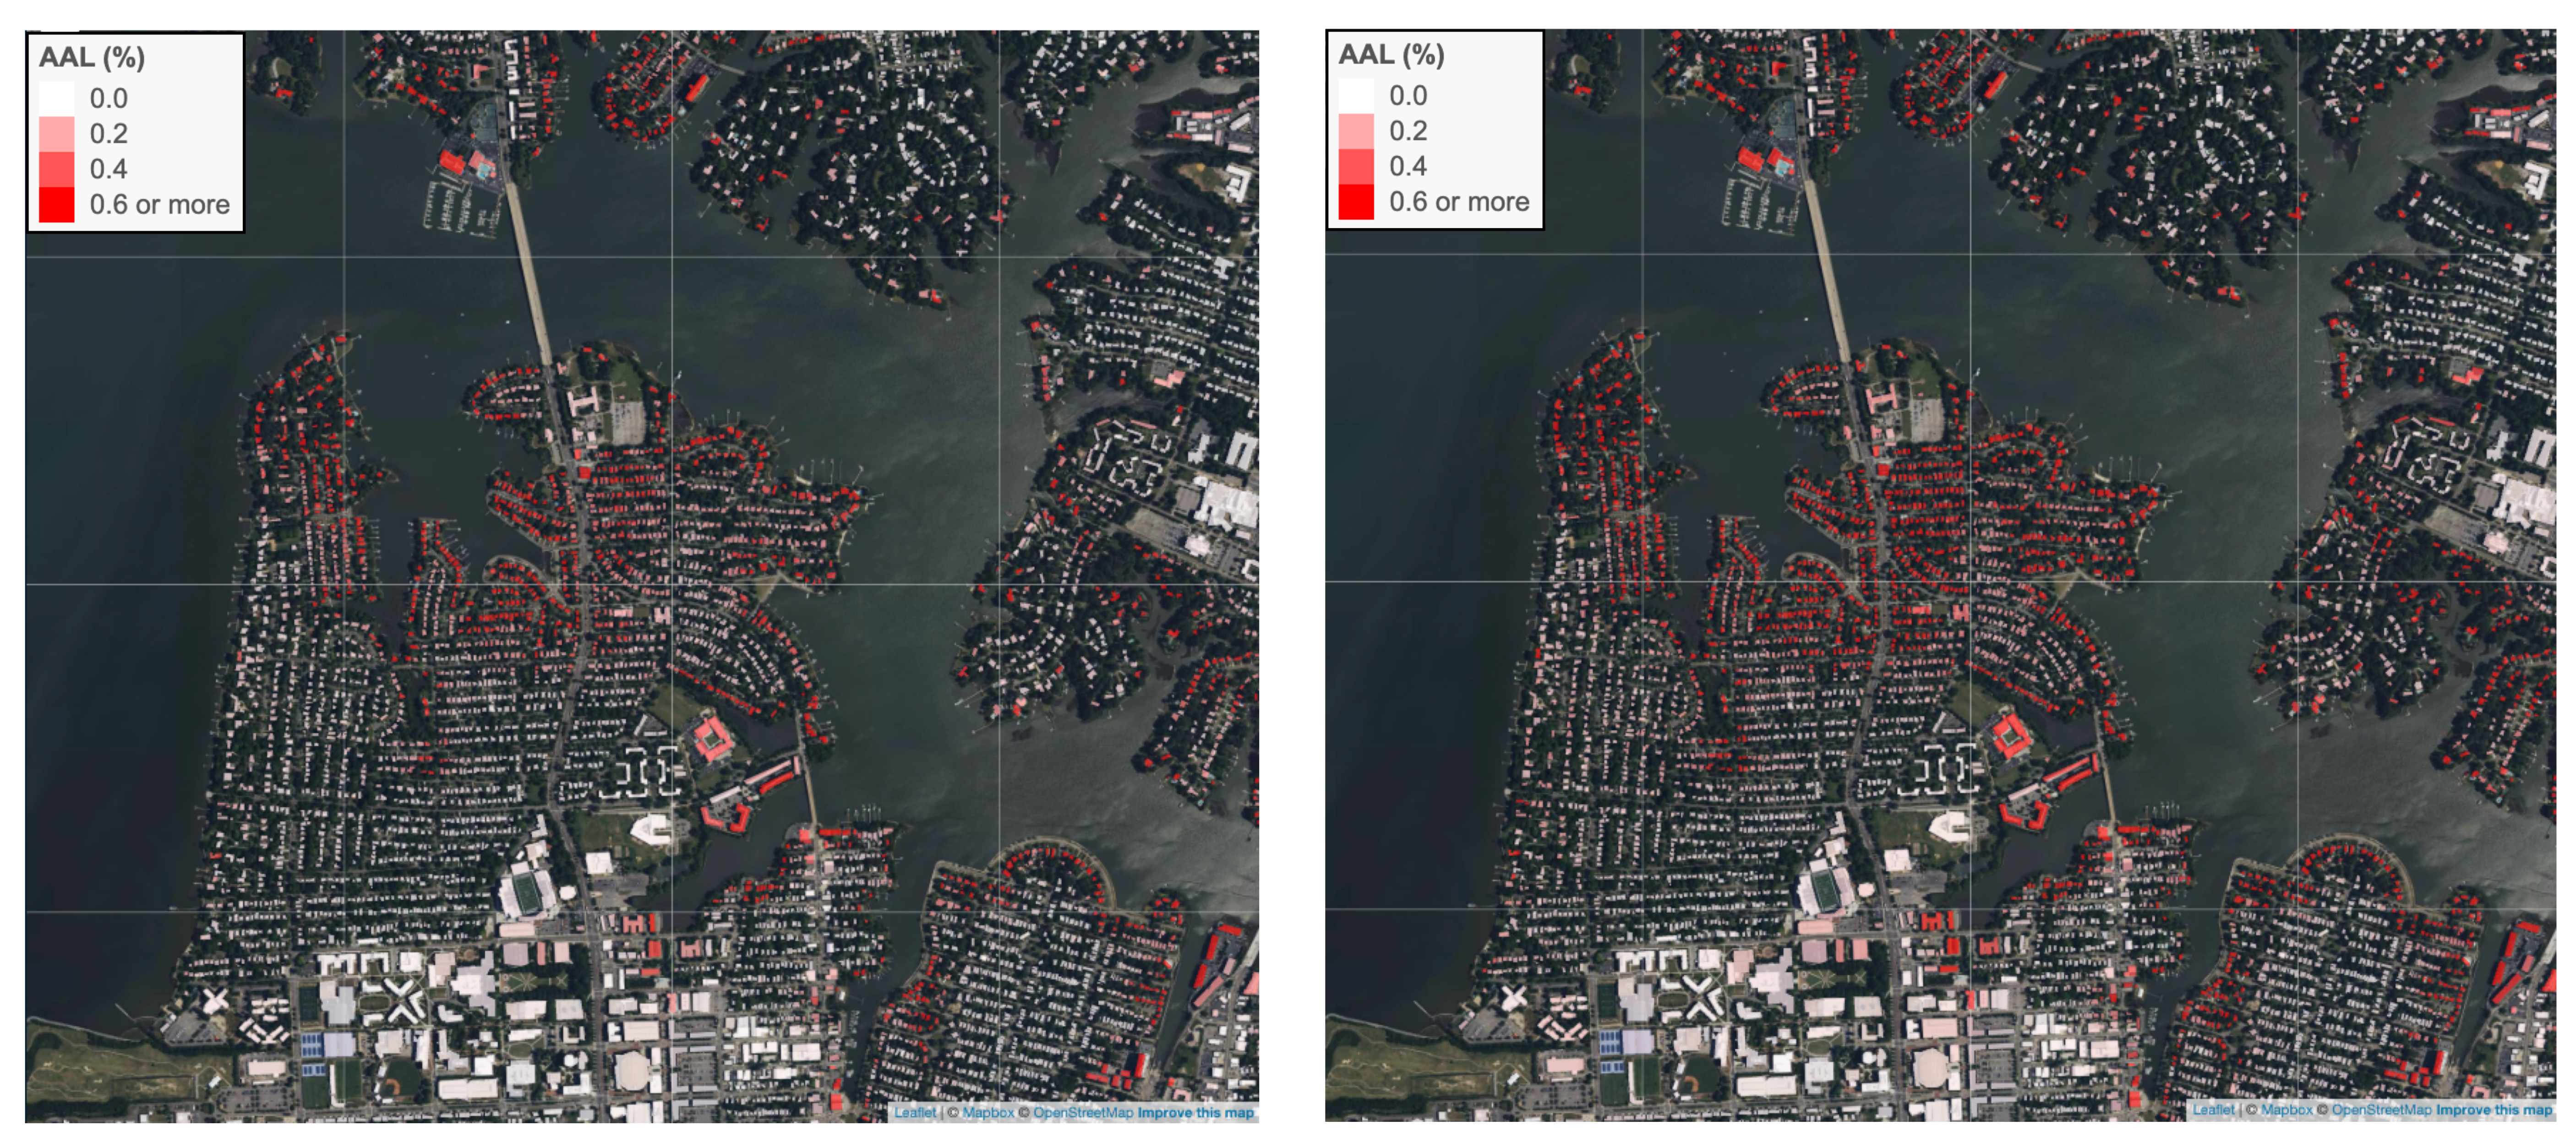
Figure 2. A neighborhood in Norfolk, Virginia, with building footprints shaded by coastal flood risk (annual average loss projections as a percentage of property value due to coastal flooding) in 2020 (left) and under a Shared Socioeconomic Pathway 5-8.5 climate scenario2 in 2050 (right). Source: ICE as of 04/08/2025.
It can be challenging to understand and map these sorts of climate risks. On top of the uncertainties inherent in climate models,3 many exposure models approximate buildings as a single geographic point when, in fact, large structures like distribution centers, convention centers, stadiums, airports, and malls often have spatial footprints measured in thousands of square meters.
Given the difference that 100 meters can make for perils like flooding — in some cases, inundation versus no flooding — approximating buildings as point locations can make it difficult to assess which structures might be impacted under different climate risk scenarios.
To meet this challenge, ICE Climate has constructed next-generation global exposure datasets that incorporate information about building footprints, including data from several propriety and open information sources that incorporate about 1.6 billion building footprints worldwide. The power of this granular building-level approach is that it allows ICE Climate to aggregate and assess risks consistently, anywhere in the world — whether the risks are associated with global corporations and their assets, the homes in pools of mortgages and real estate portfolios, or the buildings located within a specific municipality/local authority or sovereign nation.
The ICE Geospatial Platform has long enabled clients to gain valuable insights into climate risks associated with the U.S. municipal bond and mortgage-backed security markets. The global expansion of this platform now extends these insights to corporate and sovereign debt markets. In order to facilitate financial decision making, risk projections are translated into scores and climate value-at-risk metrics that measure potential financial loss.
Figure 3. A selection of 100,000 corporate asset locations in ICE’s corporation location dataset (about 3% of the over three million locations). Source: ICE Climate

In the coming years, these kinds of climate-related risks will increasingly affect individuals, communities, countries, and international financial markets. Armed with ICE Climate data, market participants will be able to factor climate risk into their fundamental analysis and make more informed decisions about allocating capital in the future.
ICE Climate’s capabilities extend beyond quantifying long-term climate risks and their potential financial impacts around the world. By integrating information about the locations of extreme weather events, the team is also able to provide information about the imminent or ongoing exposure of financial assets to active wildfires, tornados, hurricanes, and floods.
Figure 4 demonstrates how ICE Climate identified over 200 local municipal entities exposed to an April 2024 tornado swarm in Oklahoma, with a total of over $10 billion in outstanding U.S. municipal debt.
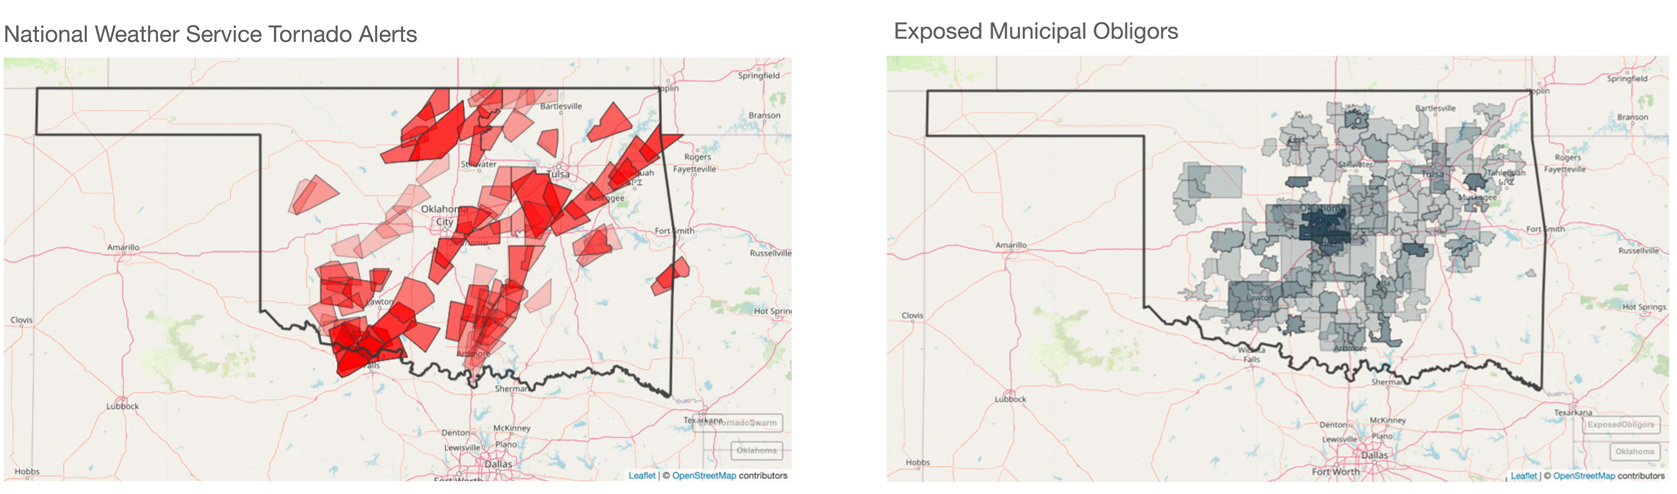
Figure 4. (Left) Tornado alerts in Oklahoma on the night of April 27-28, 2024. (Right) Map of issuer footprints with outstanding debt within Oklahoma that also overlap with these alert areas. Source: ICE as of 12/01/2024.

The data is also readily applicable in analyses of exposure to larger storms. In the case of Hurricane Milton, which made landfall in central Florida as a category 3 storm in October 2024, ICE Climate was able to identify 650 municipal issuers linked to 17,000 municipal bonds.
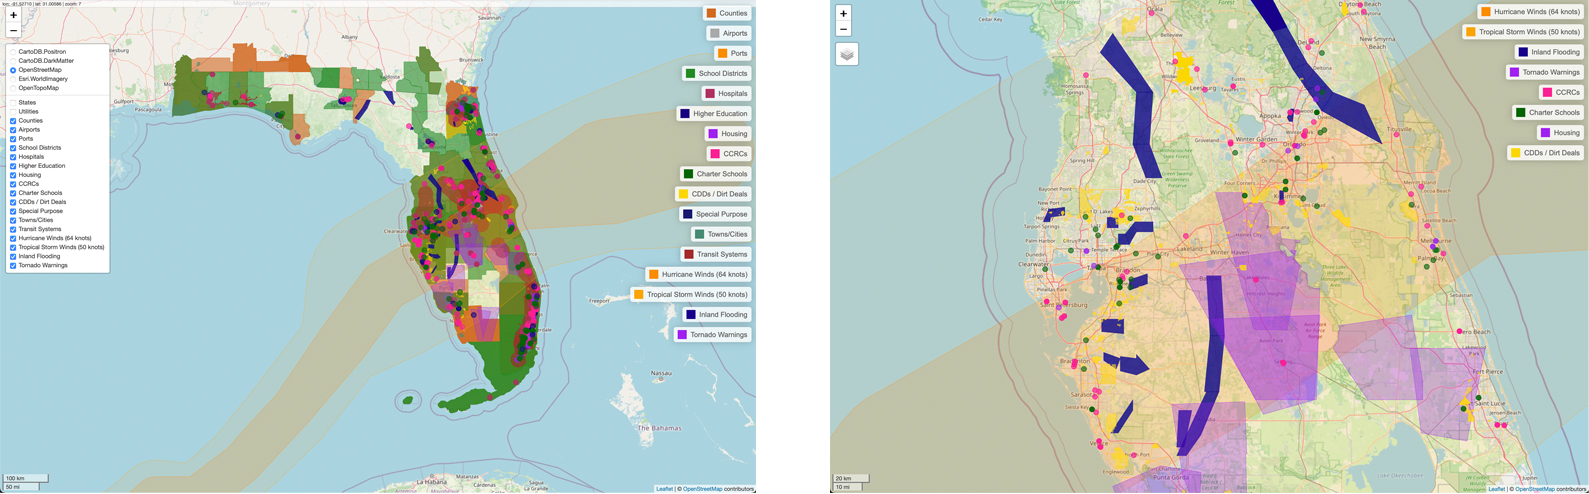
Figure 5. (Left) Track of Hurricane Milton on October 9-10, 2024 overlaid with distinct municipal issuers in the state of Florida. (Right) A closer look at the individual types of issuers exposed to hurricane-force winds. Source: ICE Climate
Taking our analysis even deeper, ICE geospatial and reference data also enable sector-specific exposure analyses, in this case focusing on retirement communities, charter schools and housing development districts exposed to hurricane-force winds during the storm.

And in the case of the January 2025 southern California wildfires, the ICE Climate database was able to monitor and track the development of the various conflagrations which - in the case of the Palisade fire by itself - impacted 30 municipal entities and over 3,000 municipal securities.
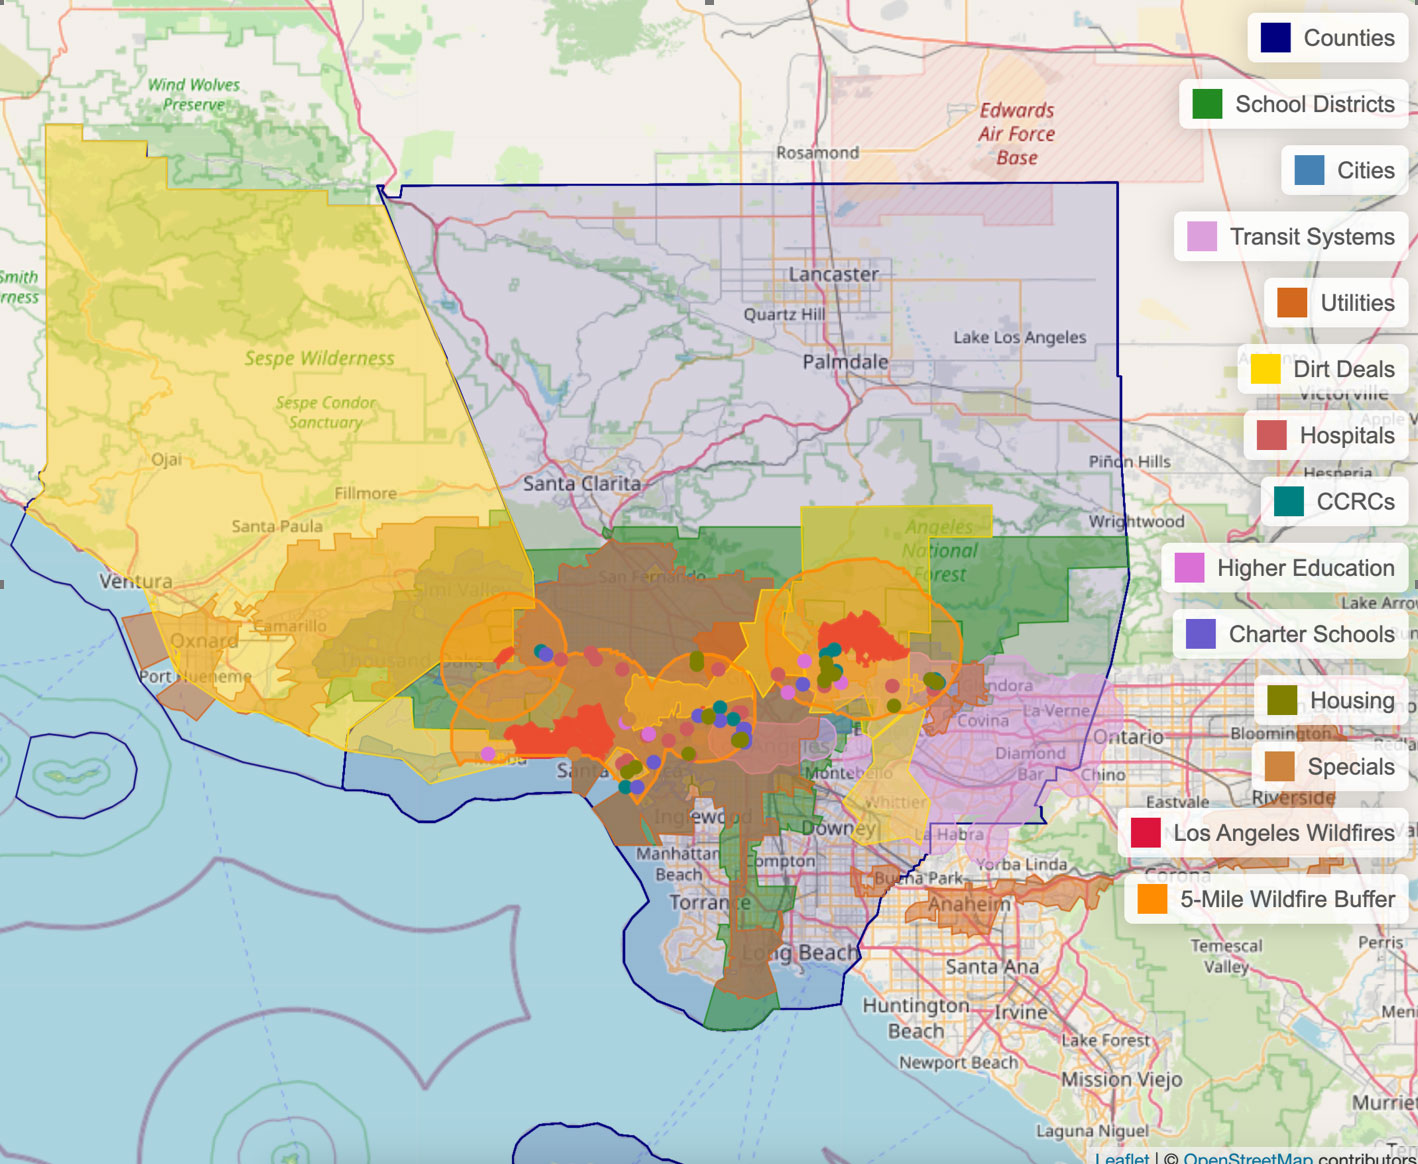
Figure 6. Extent of the Palisade, Eaton & Kenneth fires and impacted southern California municipalities, January 10, 2025. Source: ICE Climate

While these examples are retrospective, ICE Climate’s geospatial platform is designed to inform both short-term and long-term financial decision-making into the future. Investors can use the platform to make tactical and short-term decisions about securities and assets exposed to active or forecasted extreme weather events like tornados, hurricanes, wildfires, and floods.
At the same time, the ICE geospatial platform also provides an extended view — projections of global climate-related losses out to 2060 under three different climate scenarios — enabling investors and asset managers to take a more strategic and long-term approach.
When combined with ICE’s climate transition metrics, the ICE geospatial platform now provides clients with a holistic perspective on their climate-related risks, regardless of whether these risks stem from decarbonization costs, long-term projected property value losses associated with floods, hurricanes, or wildfires, or the immediate impacts of an active extreme weather event.
ICE Climate Risk Solution
Physical Risk
3 million corporate asset locations
20,000 companies
- Hurricane/Wind
- Wildfire
- Flooding: coastal, fluvial, pluvial
- Extreme heat
- Extreme cold
Transition Risk
5 million private companies modelled data
1.8 million securities covered
30,000 public companies analyzed
- Scope 1 & 2 Emissions/Intensity
- Scope 3 Emissions/Intensity (all 15 categories)
- Implied Temperature Rise (ITR)
- Emissions reduction targets
- Avoided emissions
Figure 7. Key statistics and inputs of the ICE Climate Physical Risk and Transition Risk geospatial datasets. Source: ICE Climate.
In the upcoming years, extreme weather events will affect individuals, communities, and countries across the world, as well as the international financial markets that tie us together. At ICE Climate, our core mission is to provide data and insights to help financial market participants build resilience and manage risks. The global expansion of the ICE geospatial platform allows us to provide these kinds of insights across asset classes, today and into the future — anywhere in the world.
1 Global ML Building Footprints, Microsoft. Available at: https://github.com/microsoft/GlobalMLBuildingFootprints
2 O’Neill et al. (2015) The roads ahead: Narratives for shared socioeconomic pathways describing world futures in the 21st century. Global Environmental Change, JGEC-1388. Available at: https://korbel.du.edu/wp-content/uploads/2015/01/ONeill-et-al-2015-The-Roads-Ahead.pdf
3 Roston, E, Karra, E, Kaufman, K & A Rangarajan (9 Aug 2024). The Risky Business of Predicting Where Climate Disaster Will Hit. Bloomberg. Available at: https://www.bloomberg.com/graphics/2024-flood-fire-climate-risk-analytics/