The full cost of home ownership
ICE Climate integrates information about insurance premiums, property taxes, and utility bills to provide a more complete picture of home affordability
April 30, 2025
Key takeaways
- The full cost of homeownership in the United States encompasses not just monthly mortgage payments, but also property taxes, insurance costs and energy bills that may change over time.
- These variable homeownership costs may become more unpredictable in the face of climate risks.
- ICE Climate is integrating information about insurance premiums, property taxes, and utility bills to provide a more complete picture of home affordability across the nation.
During the lead-up to the 2008 Financial Crisis, many homeowners were forced into delinquency when their adjustable-rate mortgage reset to higher interest rates, even as home values dropped. Today, adjustable-rate mortgages (ARMs) are relatively rare in the United States. Based on ICE McDash Loan Catalogue records, in early 2024 about 95% of mortgages in the United States were fixed-rate loans in which homeowners owe the same principal and interest payments every month. However, the full cost of homeownership includes more than just principal and interest payments: mortgage-holding homeowners are also required to carry home insurance, pay property taxes, and pay for essential services like energy and water.
Unlike principal and interest payments on a fixed-rate mortgage, these additional homeownership costs vary month to month or year over year. In some parts of the United States insurance premiums are rising to levels that are unaffordable for many homeowners, with some insurers pulling out of Florida and California altogether because of increasing physical effects of climate risks. For local governments that depend on property tax revenues, falling home values in high-risk areas could lead to budget shortfalls and may cause many municipalities to raise rates.1,2
Many households may see water bills increase over the next few years, as utilities invest in technology to remove dangerous PFAS chemicals, replace lead lines and update aging infrastructure.3 Energy represents perhaps the most variable cost of all: in the Northeast and Upper Midwest households, ICE Climate's estimates suggest that monthly bills can be more than $400 higher in winter than in summer.
Although these variable homeownership costs are not part of a mortgage, from a home affordability perspective, they might as well be. A household’s ability to make timely mortgage payments depends not only on its mortgage rate and loan size, but also on the overall cost of living in any given location. A rapid increase in insurance, property taxes or utilities could have the same effect as the resetting of an adjustable-rate mortgage.
In previous articles, ICE Climate introduced its approach to estimating energy usage, emissions, and monthly energy bills for more than 100 million single-family households. Here we combine these energy cost estimates with water cost estimates4 and property tax, mortgage, and insurance data from the ICE McDash Loan Catalogue5 to provide a more complete picture of the potential affordability challenges facing homeowners across the United States. The underlying data is at the individual property or loan level. In the discussion to come, we aggregate these property and loan-level data to county averages to get a sense of the broad patterns nationwide.
The fixed costs: principal and interest
Homeowners’ annual costs for principal and interest are highest in cities — places like New York, Denver, Seattle, San Francisco, and Los Angeles (Figure 1).
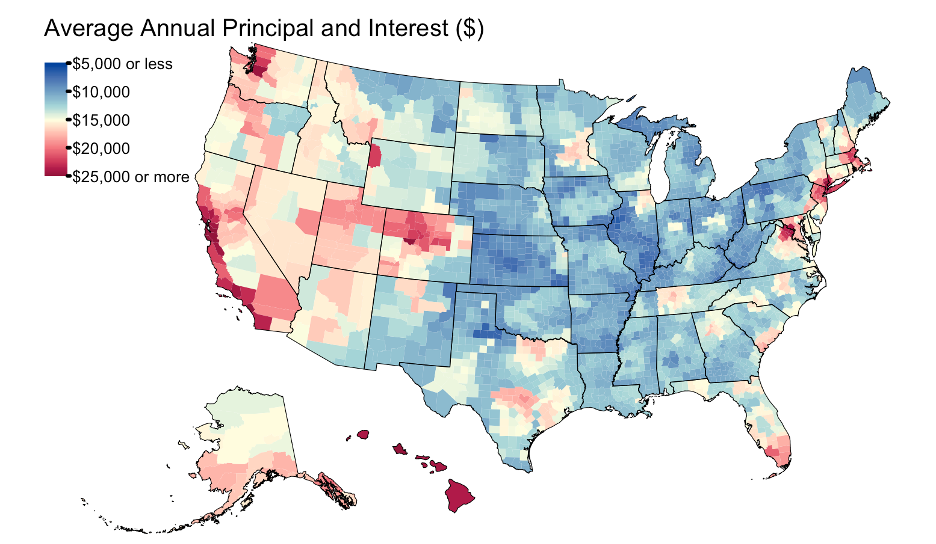
Figure 1. Average annual principal and interest payments by county in 2024 based on data from active single-family loans in the ICE McDash Loan Catalogue.
Source: ICE McDash as of 12/20/2024.
Homeowners in these urban counties pay upward of $25,000 annually in principal and interest payments on average, but these costs are largely fixed over 15- or 30-year mortgage terms.
The variable costs: property taxes, utilities, and insurance
Between 2019 and 2023, property taxes on single-family homes increased by 24% on average across the United States. In some cases, because of rapidly increasing housing values, individual households have seen over 30% increases in their tax bills from one year to the next.7 As of December 2023, households in the Northeast paid some of the highest property taxes in the country, a trend driven by high rates and high property values (Figure 2).
In the face of climate change, property tax rates may become still more unpredictable. Homes in high-risk coastal locations, for example, are estimated to be significantly overvalued. As climate risks become priced in, many municipalities may see rapid decreases in revenue generated by property taxes. The property tax rate changes that local governments may implement in response to such large-scale shifts in their tax bases are difficult to imagine and will likely depend on local politics, state laws, and many other factors.
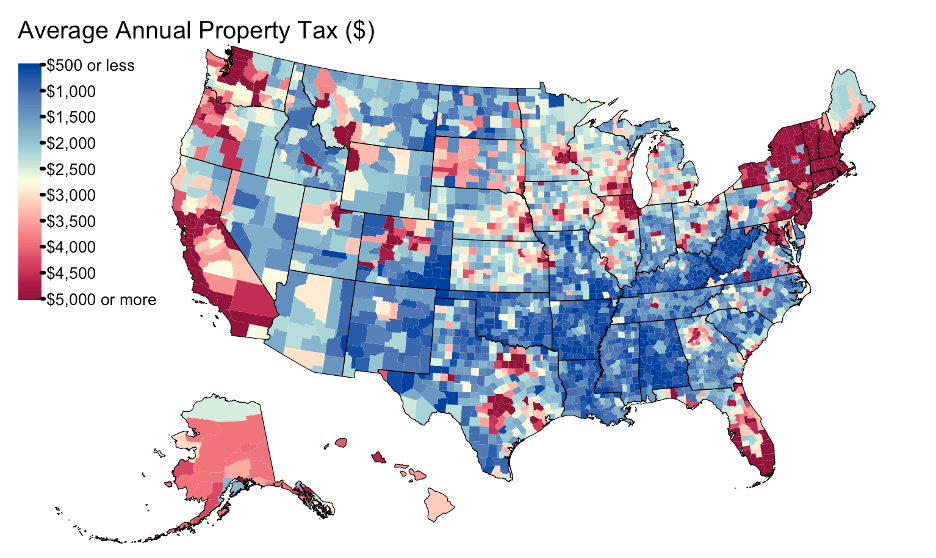
Figure 2. Average annual property taxes for single-family homes in 2024 by county-based data from escrowed loans in the ICE McDash Loan Catalogue and ICE Property Assessment Tables.
Source: ICE McDash, ICE Property Assessment Tables, and ICE Climate as of 1/9/2025.
The costs of water and energy also vary, depending on geographical location, time of year, and many other factors. ICE Climate’s estimates of energy costs for over 100 million single-family households (Figure 3) are discussed in a recent series of articles in an upcoming whitepaper, but energy bills are not the only regular utility bill that many households must pay.
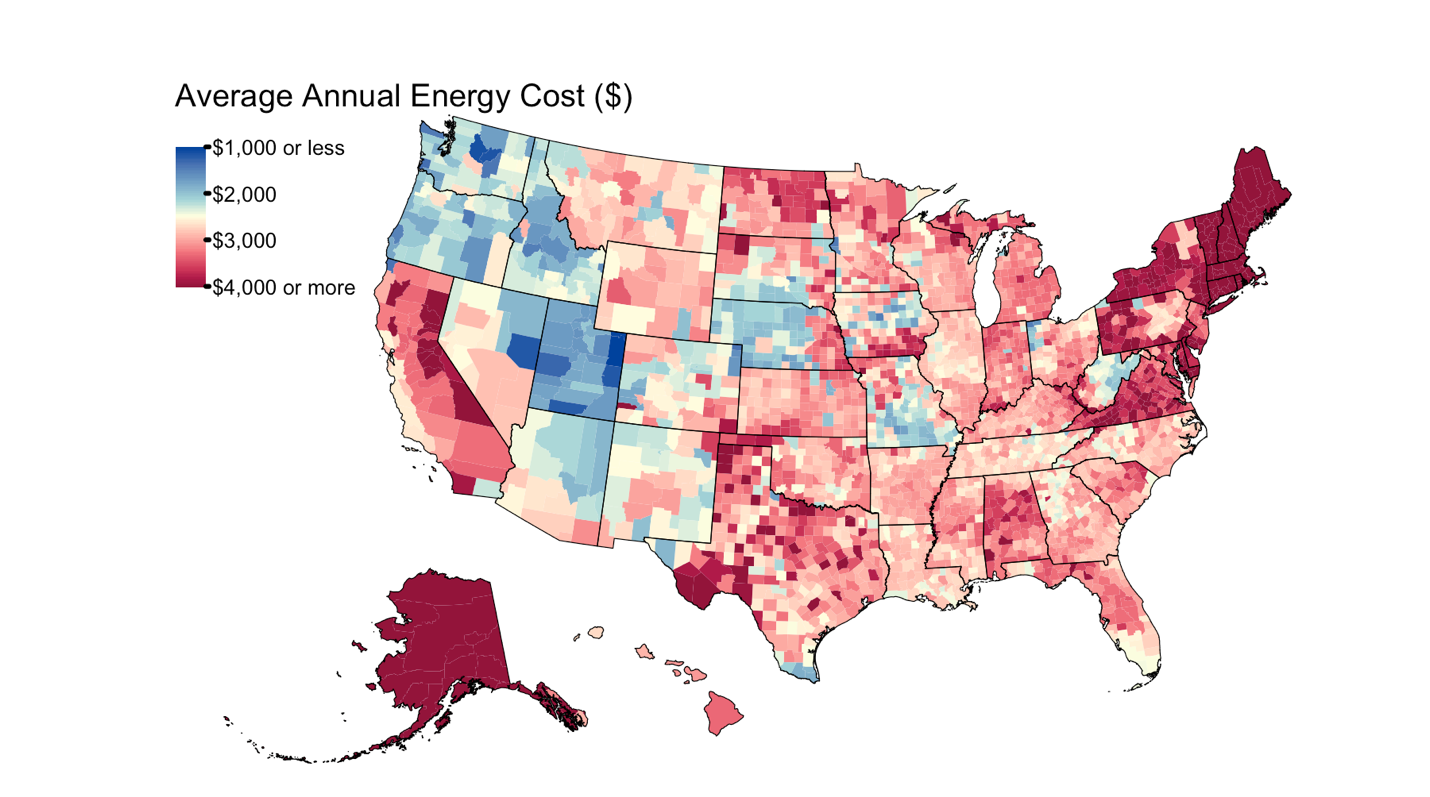
Figure 3. Estimated average annual household energy costs for single-family homes by county.
Source: ICE Climate as of 1/9/2025.
Water bills can also have significant impacts on a household’s budget. In general, water costs are highest in the Pacific Northwest, Alaska, and West Virginia, with countywide averages of annual water costs exceeding $1,000 in many places (Figure 4). New Environmental Protection Agency guidelines on ‘forever’ (PFAS) chemicals have led many cities to warn that the infrastructure upgrades and additional water treatment facilities required to comply with the mandates will result in significant costs to be passed onto the consumer over the next three years.9
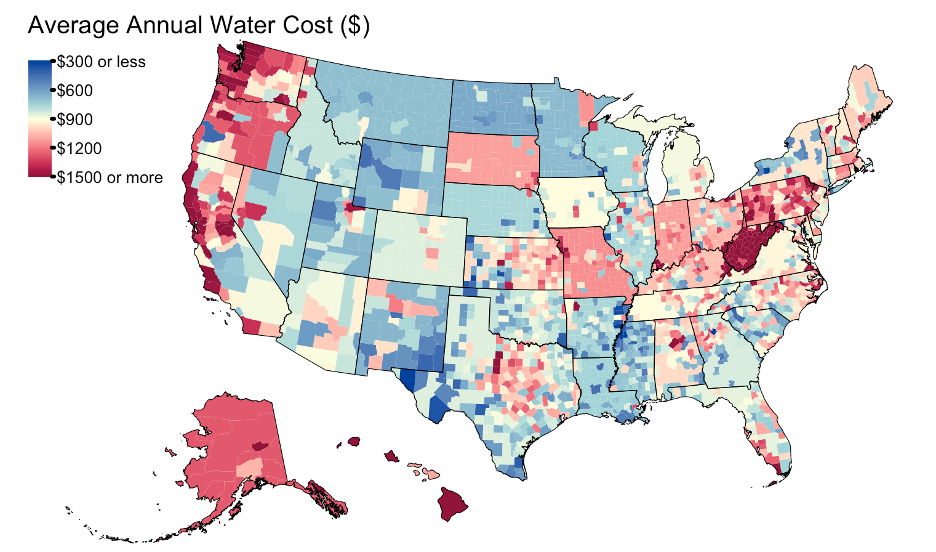
Figure 4. Average estimated annual household water costs for single-family homes by county. 10
Source: ICE Climate as of 1/9/2025.
Finally, and perhaps most visibly, insurance costs are rising for many homeowners. Two large insurers — State Farm and Allstate — made headlines in the summer of 2023 after the companies announced that they would no longer issue new policies in California.11 Farmers Insurance followed, announcing that it would not issue new policies in Florida.12 However, despite the media attention on the insurance situation in Florida and California, the challenge extends well beyond these two states.
Households across Idaho, Colorado, Texas, and South Dakota (among others) have also been denied coverage or seen rapidly rising premiums.13,14,15 One major contributor to this rise over the past few years is the National Flood Insurance Program’s (NFIP) implementation of Risk Rating 2.0. The program was first rolled out in 2021 with the goal of trying to bring flood insurance premiums into better alignment with risk. Although the NFIP limits to 18% the annual premium increases that individual homeowners can experience, some policyholders may eventually see premium increases that can be as large as 300%.16
The insurance crisis is likely to worsen. In a 2021 report by DeltaTerra Capital, the “insurance gap”— the disparity between the amount insurers are charging in premiums today and the amount they need to charge to cover their risk — is estimated to be about $30bn every year.17
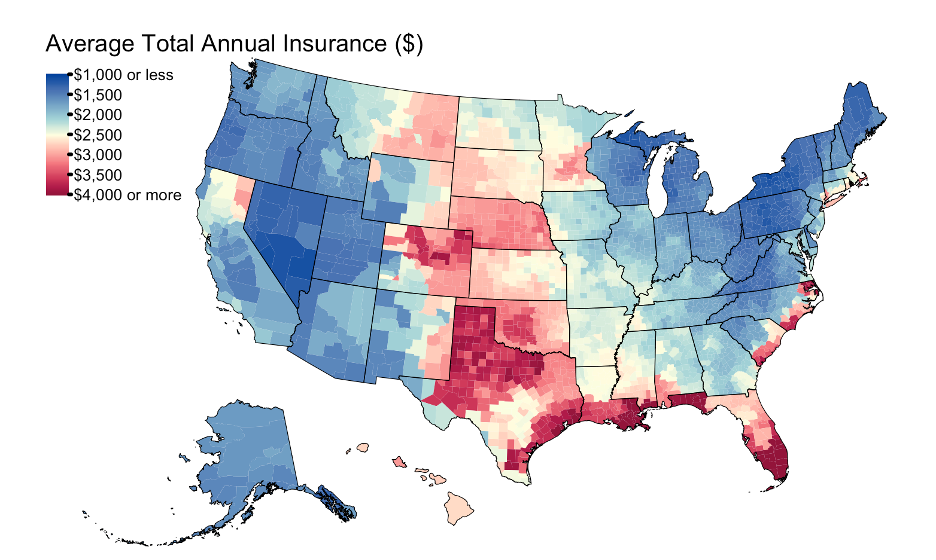
Figure 5. Average annual home insurance costs by county in 2024 for single-family active loans in the ICE McDash Loan Catalogue.
Source: ICE McDash (aggregated from zip code-level data) and ICE Climate as of 1/09/2025.
Currently, homeowners are paying the largest average insurance premiums (upward of $3,000 on average) in counties in Florida, along the Atlantic and Gulf Coasts, and in the storm- and tornado-prone areas of the central United States (Figure 4).
Where is the full cost of homeownership highest?
The costs of homeownership — including water, energy, principal and interest payments, property taxes, and insurance — tend to be highest in urban centers, along the west coast and coastal areas of the Northeast. However, for many homeowners, it may not be the absolute cost that matters most in terms of affordability.
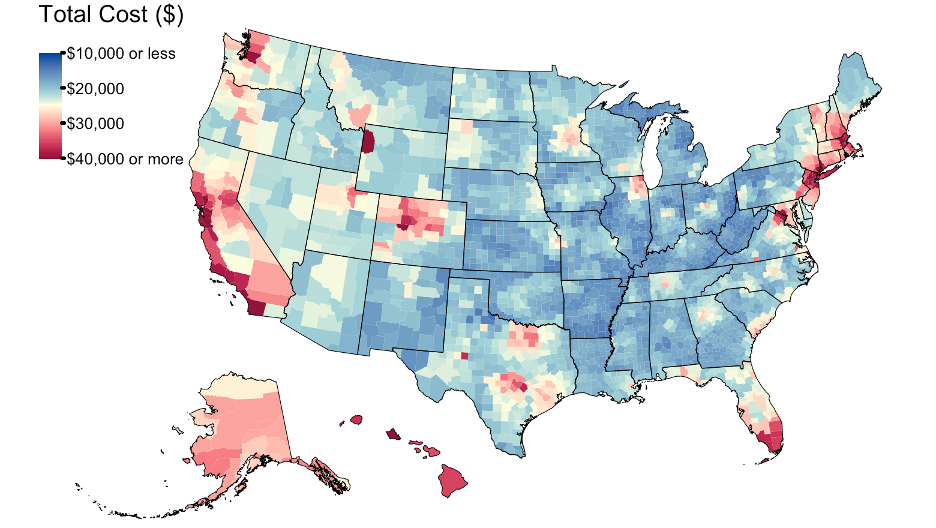
Figure 6. Estimated average annual total homeownership-related costs, including principal and interest, insurance, property taxes, energy, and water costs by county.
Source: ICE Climate as of 1/09/2025.
Where will variable costs have the biggest impact on affordability?
Increases in energy and water bills, insurance premiums, or property taxes are likely to have the largest impacts on homeowners for whom these costs represent a large portion of their housing budget. It is easy to understand this dynamic with an example: for a family living in Brooklyn with $5,000 in monthly housing costs, an annual insurance premium increase of $600 would represent only a 1% increase in their overall cost of homeownership. By contrast, for a household in rural New York with $1,000 in monthly housing costs, the same annual insurance hike would increase their cost of homeownership by 5%.
To understand the scale of the affordability challenge across the country, the percentage of total homeownership costs that are variable may be a particularly useful barometer.

Figure 7. The estimated percentage of total costs (principal and interest, insurance, property taxes, energy and water costs) that are variable (insurance, property taxes, energy, and water costs) by county.
Source: ICE Climate as of 1/09/2025.
Viewed through this lens, households in Alaska, New England, Florida, Texas, Kansas, South Dakota and Nebraska could face some of the most significant affordability challenges from variable housing costs (Figure 7). These patterns are driven by different costs depending on the location — energy bills in Alaska, property taxes and energy bills in Vermont and New Hampshire, property taxes and insurance in Florida, and the combination of high insurance premiums and low fixed principal and interest payments in Kansas, South Dakota, and Nebraska.
Going forward, ICE Climate will integrate climate risk projections with property taxes, insurance premiums, monthly energy bills, and principal and interest payments at the property level. The goal is to build an understanding of the complex interplay between home affordability and climate risk across the country — including the relationship of flood risk to property values and property taxes, extreme heat to energy bill variation, and hurricane risk to insurance premiums.
Get personalized support
1 Shi, L & A Varuzzo (2020). Surging Seas, rising fiscal stress: Exploring municipal fiscal vulnerability to climate change. Cities, 100 (102659).
2 Gourevitch, J, Kousky, C, Liao, Y, Nolte, C, Pollack, A, Porter, J, & J Weill (2023). Unpriced climate risk and the potential consequences of overvaluation in US housing markets. Nature Climate Change 13 (250-257).
4 Water bill estimates are derived from the 2023 Water Rates Database via the Nicholas Institute for Environmental Policy Solutions at Duke University; this database is licensed by Confluence Water Advisors, LLC, which provides estimated water bills to ICE.
5 Property tax data comes from ICE Property Assessment Tables, while insurance and principal and interest cost information come from the ICE McDash Loan Catalogue.
6 Loan data is only specified down to the zip code level, preserving borrower anonymity.
8 Gourevitch, J, Kousky, C, Liao, Y, Nolte, C, Pollack, A, Porter, J, & J Weill (2023). Unpriced climate risk and the potential consequences of overvaluation in US housing markets. Nature Climate Change 13 (250-257).
10Water bill estimates are derived from the 2023 Water Rates Database via the Nicholas Institute for Environmental Policy Solutions at Duke University; this database is licensed by Confluence Water Advisors, LLC, which provides estimated water bills to ICE. Costs are estimated based on the assumption of 5,000 gallons of water use per household per month.
17 Measuring Climate Risk in Real Estate Capital Markets, U.S. Single-Family Market (2021). Delta Terra Klima Climate Risk Report, DeltaTerra Capital LLC.
Related resources
- Read moreWhy it’s a perfect storm for mortgage-backed securities
Following a historically fast pace of rate hikes, the Fed is now expected to be on the verge of a monetary policy shift. Learn why these events could represent a perfect storm for mortgage-backed securities (MBS).
- Read moreMortgage delinquencies and climate risk
The tail risks of agency credit risk transfer pools
- Read moreInsurance affordability: a growing risk to home prices and mortgage-backed securities
Around 10M U.S. homes could face material price declines under ICE DeltaTerra base modelling scenario.