Mapping corporate exposure to approaching typhoons
July 1, 2025
Key takeaways
- Every year, typhoons in the western Pacific impact corporations across east Asia. With a dataset of over three million individual corporate locations, ICE Climate can identify corporations and corporate debt issuers exposed to the forecasted paths of these storms.
- During the 2024 typhoon season, over 388,000 corporate asset locations in the western Pacific were exposed to forecasted wind speeds greater than 50 knots.
- These exposed asset locations can be linked to over 14,000 debt issuers and their associated securities, providing early information for investors about corporate exposure
2024 Tropical Cyclones
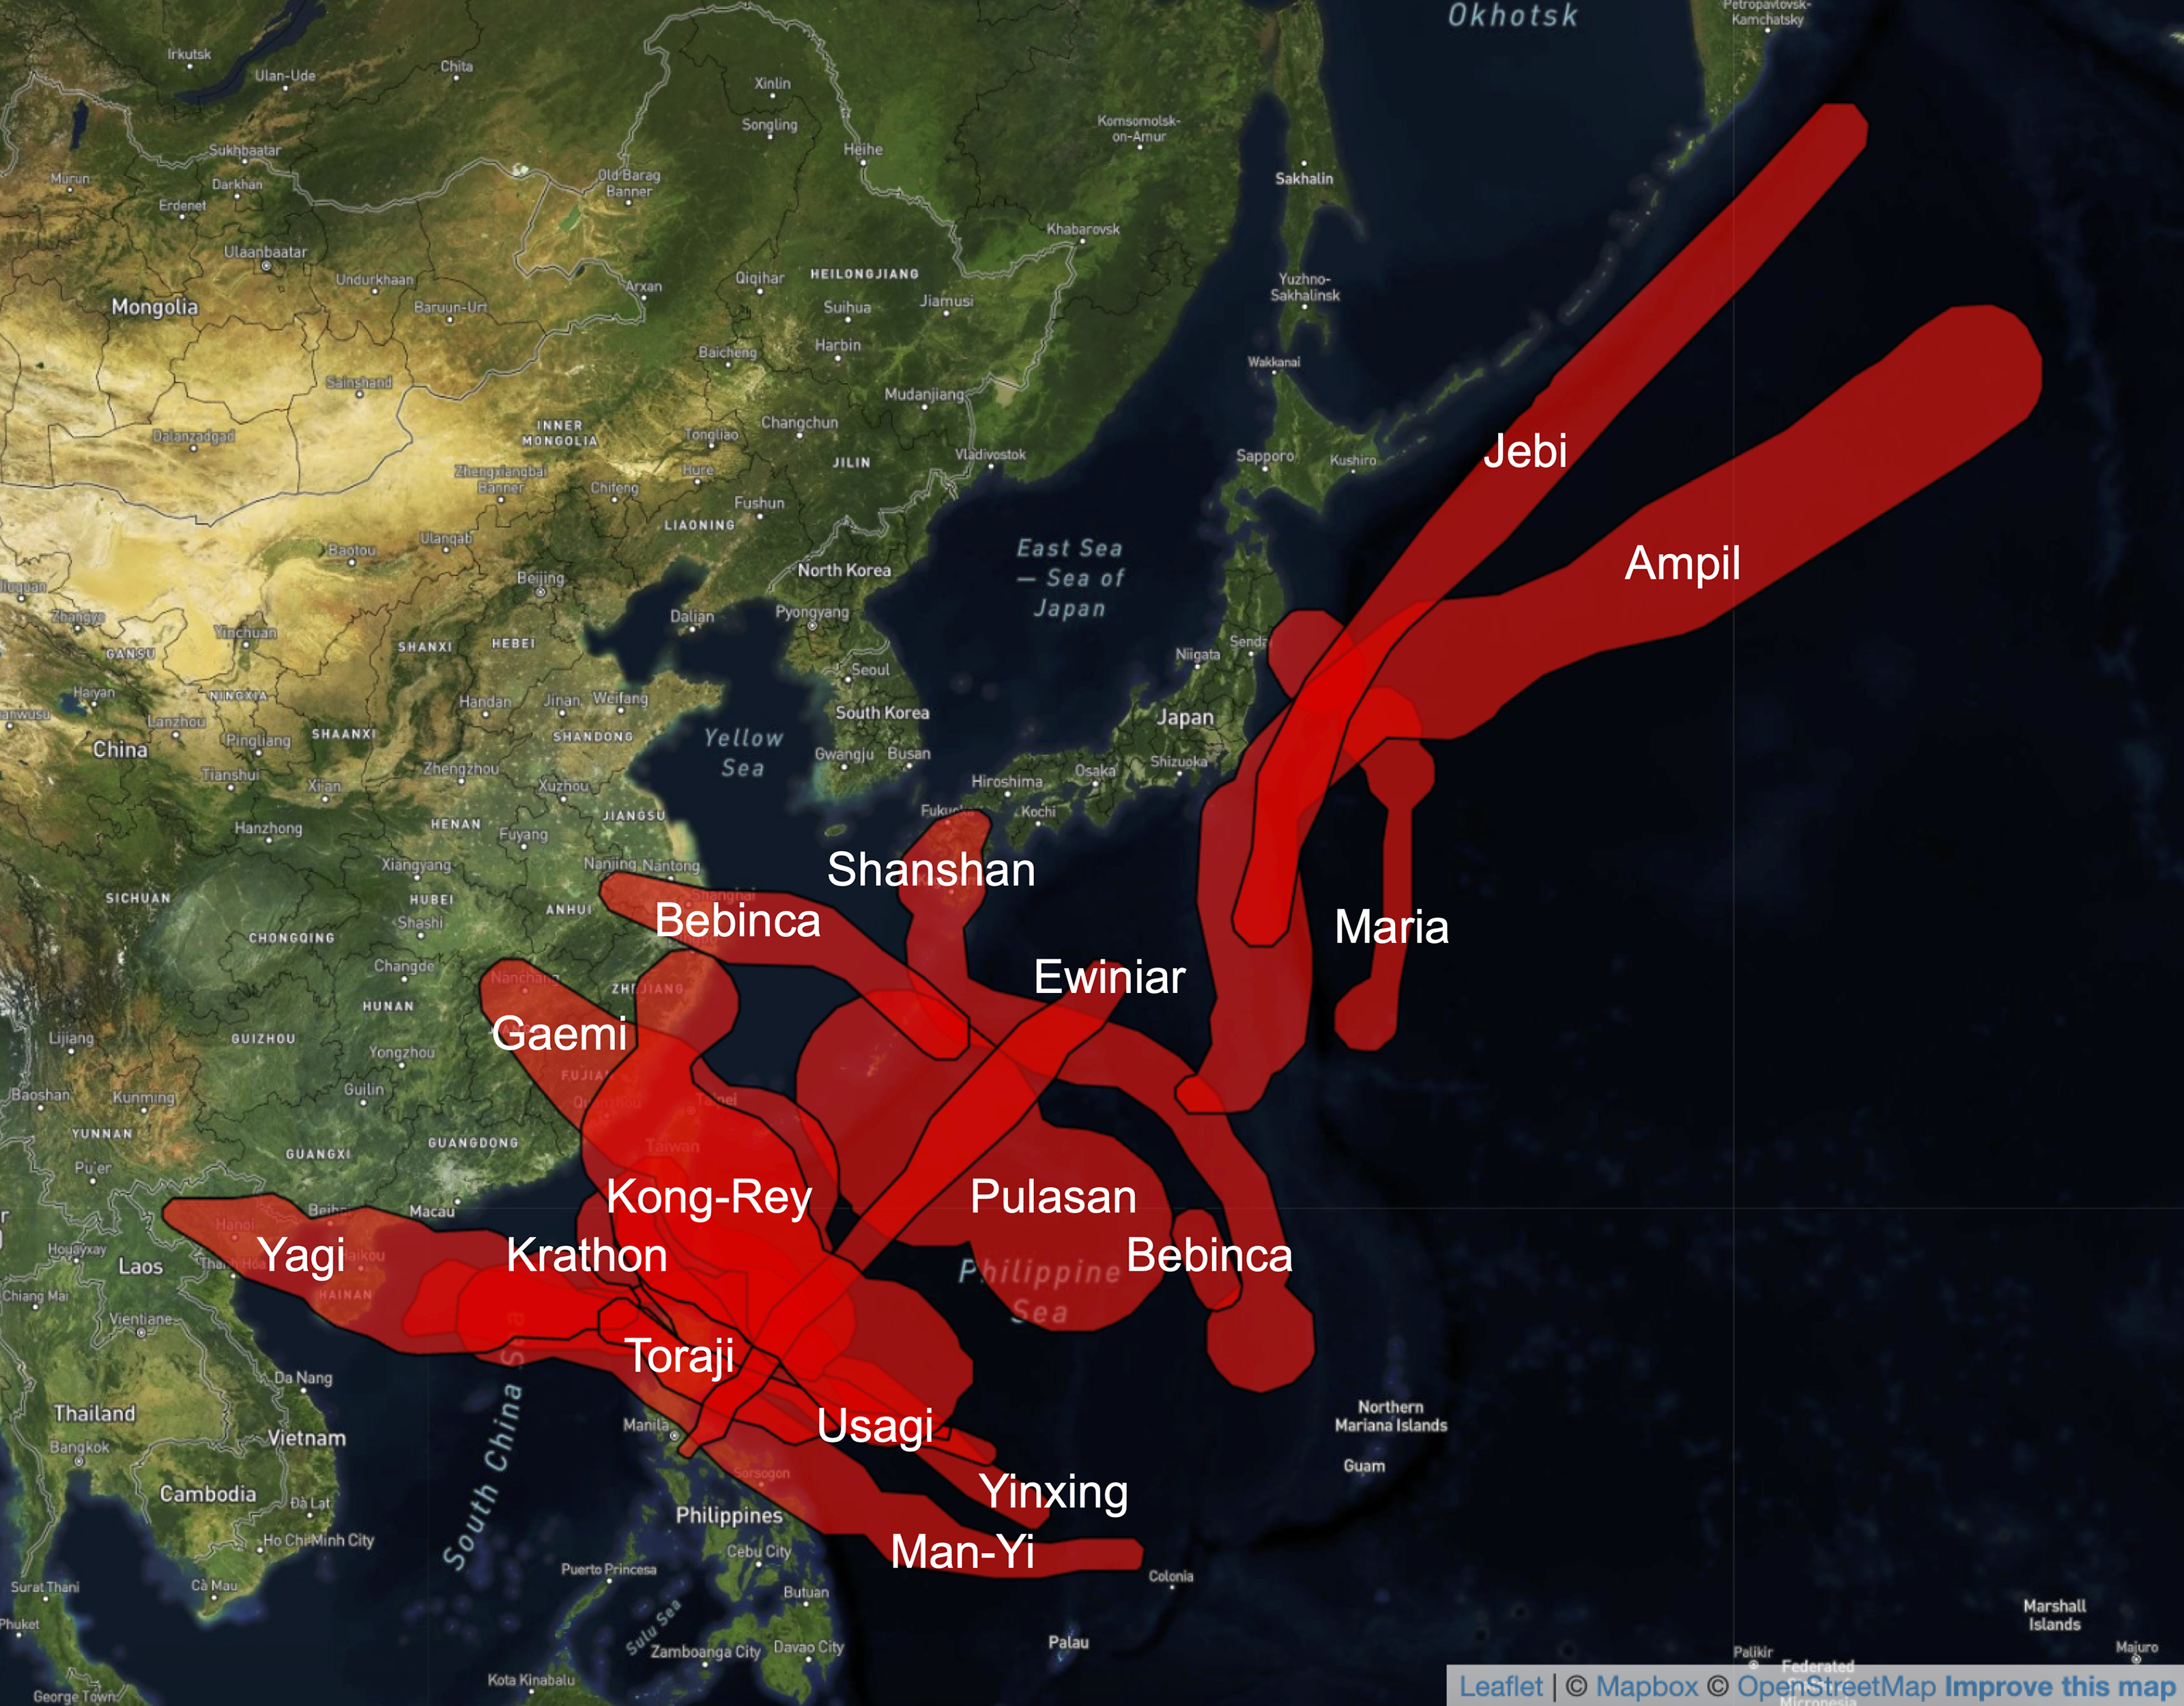
Figure 1: The forecasted tracks of 50 knot windspeeds or higher associated with the 15 western Pacific typhoons of 2024. Source: ICE Climate and the Global Disaster Alert and Coordination System as of 04/10/25.
The imminent exposure of corporations to tropical cyclones may often be important information for investors. The widespread impacts on industry in the western Pacific during the 15 typhoons that impacted the region in 2024 make this particularly clear.
Typhoon Shanshan in August 2024 forced a number of automakers and electronics companies to suspend operations in plants in southern Japan.1,2,3 A few weeks later, Typhoon Yagi impacted factories, pharmaceutical and transportation firms in Vietnam.4,5 A post-Typhoon Yagi survey also reported flooding and roof damage to factories and warehouses associated with several well-known electronics and technology companies.6
Later in the fall, Typhoon Kong-Rey made landfall as one of the strongest storms to hit Taiwan in a decade, disrupting port activity, forcing the country’s $2.5 trillion stock market to suspend trading, and leading Taiwan semiconductor company shares to decline in premarket trading.7
To inform investors about these potential risks in advance, ICE Climate can now identify corporations and corporate debt issuers in the forecasted paths of these storms, combining a data set of over three million corporate asset locations with forecasted high wind paths from the Global Disaster Alert and Coordination System.
Below, to demonstrate the power of this approach, ICE Climate examined corporate exposure to typhoons in the western Pacific during 2024.
Over 388,000 individual corporate asset locations in ICE Climate’s data set were exposed to the 15 typhoons with forecasted wind speeds greater than 50 knots (Figure 1) in 2024. Relative to other typhoons, Typhoon Shanshan and Typhoon Yagi exposed the largest numbers of corporate asset locations to such winds, at 146,000 and 94,000 assets respectively. Tens of thousands of these exposed corporate asset locations are linked to (among other business activities) wholesale trade in durable and non-durable goods, business services, retail, construction, engineering, accounting, research and management services, and eating and drinking places.
Corporate exposure to 50 knot winds (or higher) during these storms
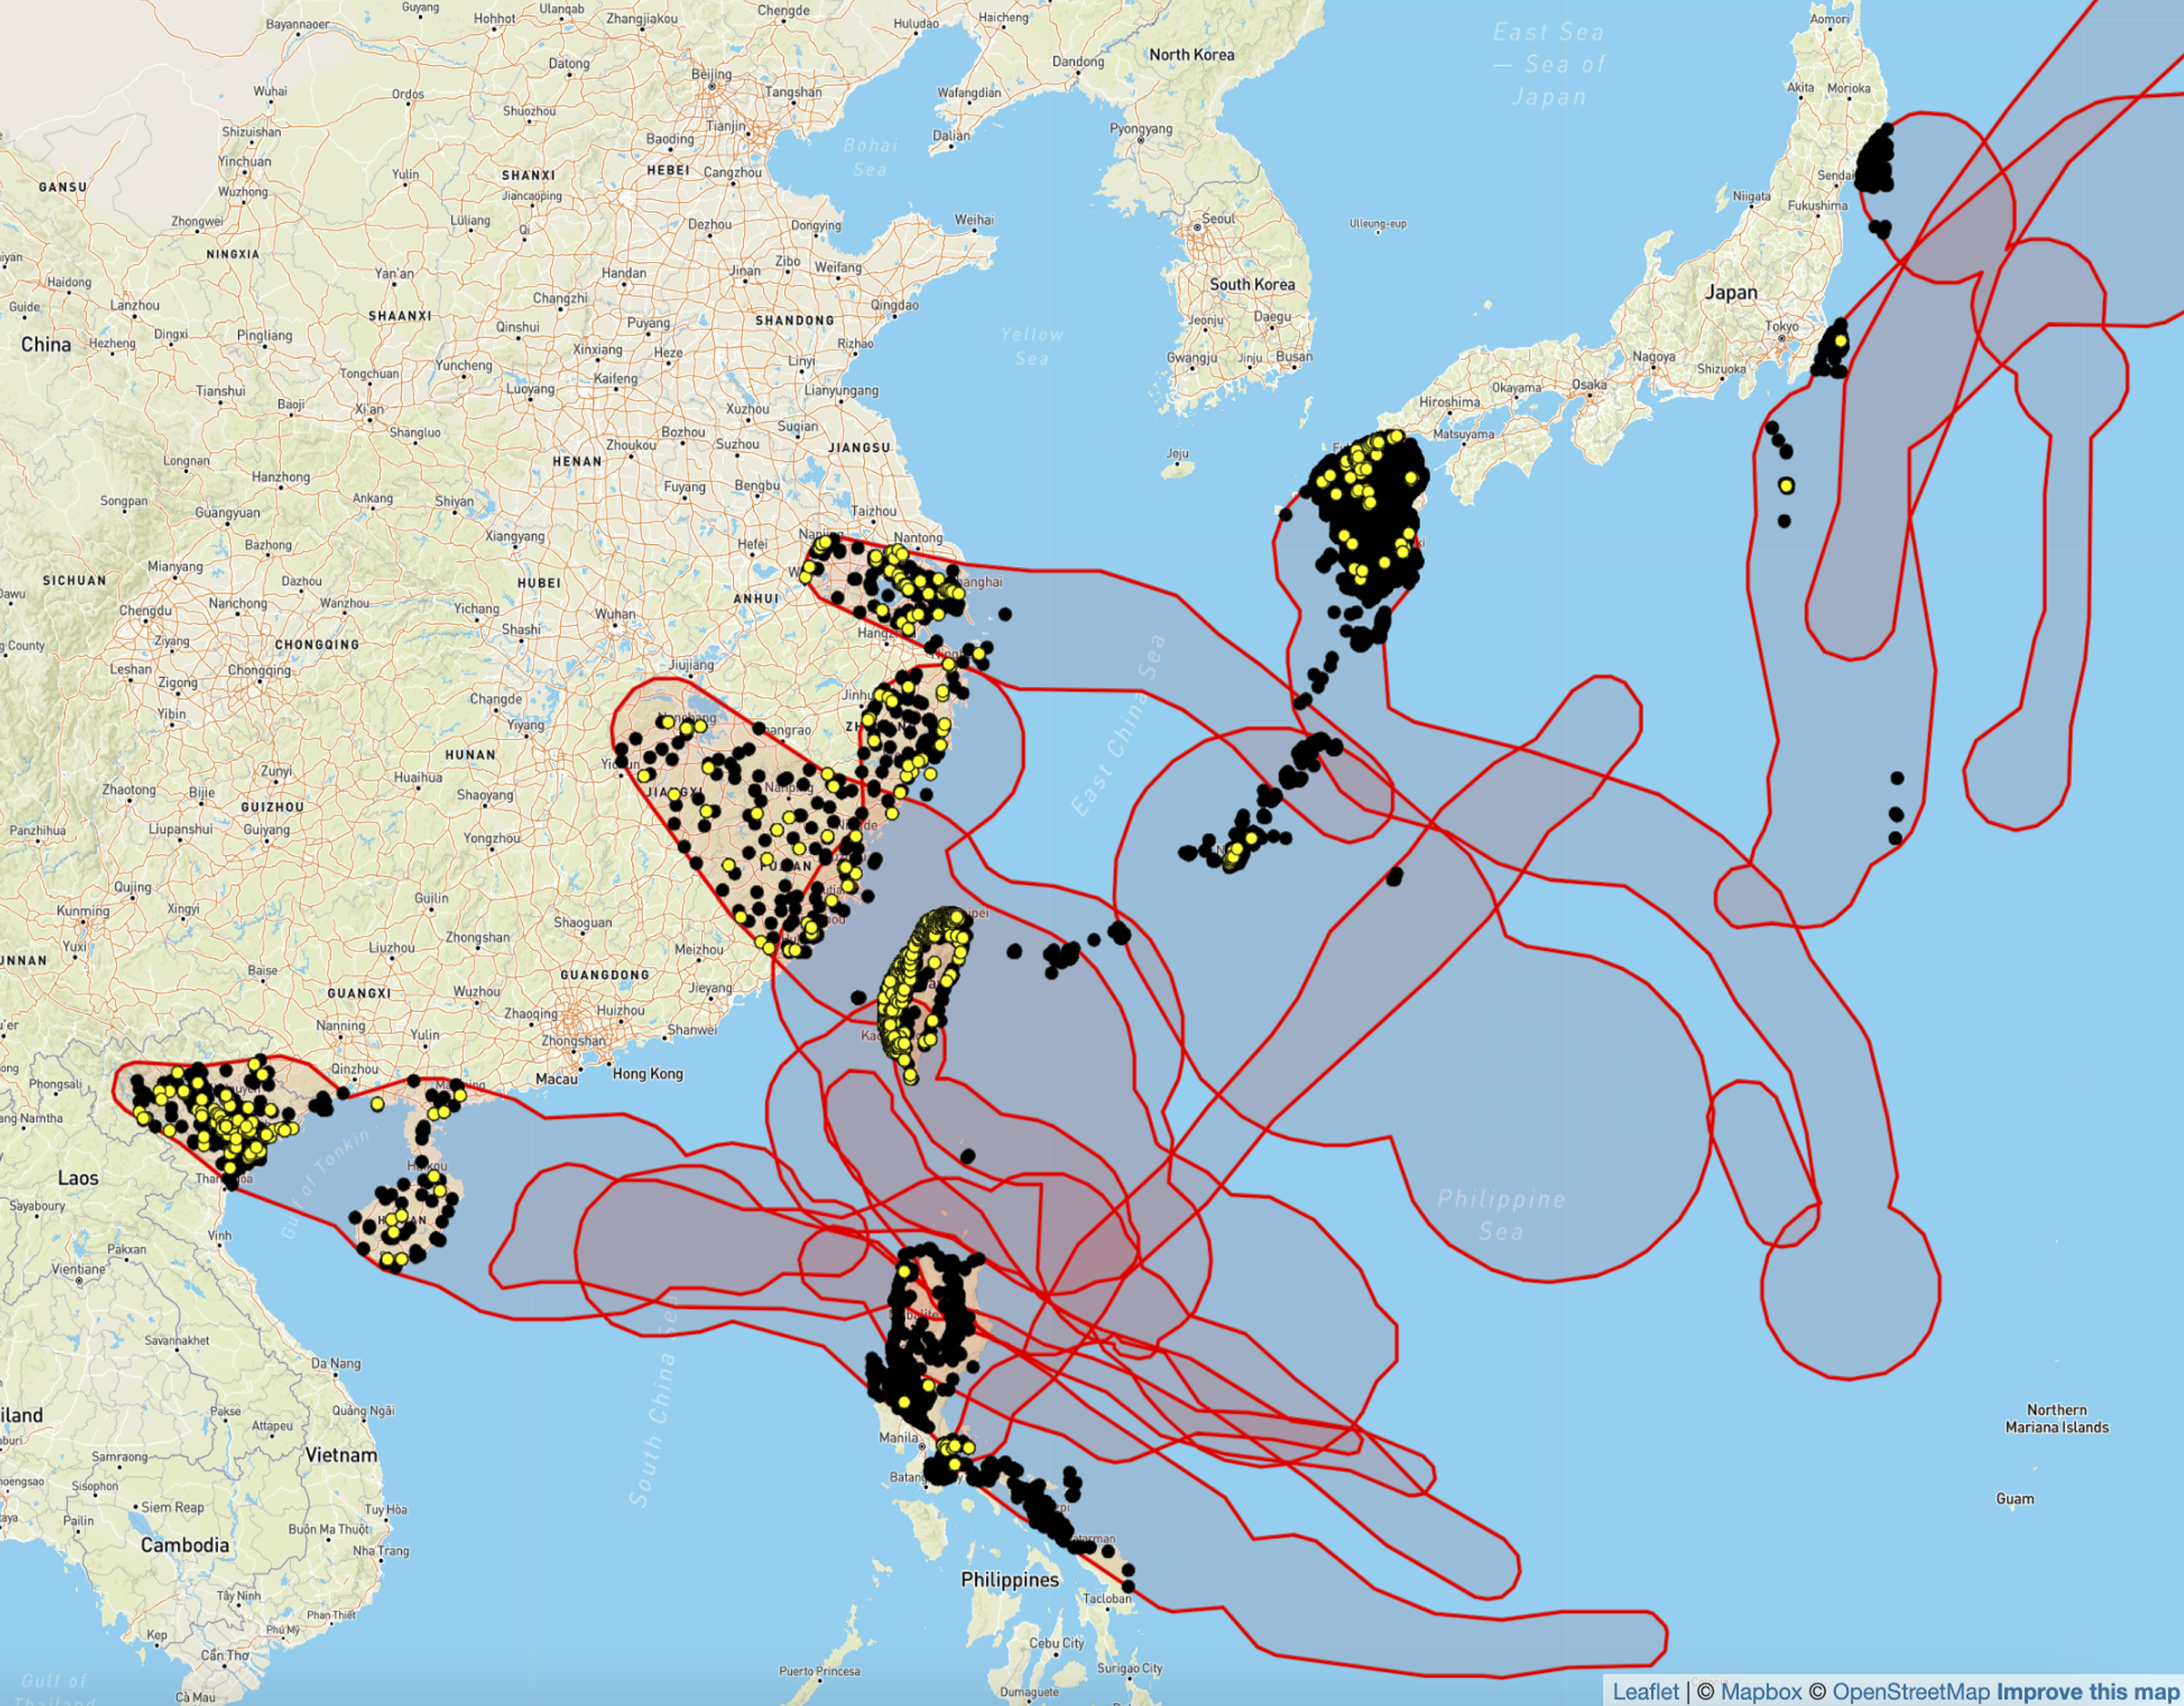
Figure 2: Corporate exposure to the 15 typhoons with forecasted wind speeds greater than 50 knots during the western Pacific 2024 season. Black dots are corporate asset locations in ICE Climate datasets that can be linked to corporate debt issuers; yellow dots are the primary locations of a corporate debt issuer. Source: ICE Climate and the Global Disaster Alert and Coordination System as of 04/10/25.
These corporate assets are linked to over 14,500 corporate debt issuers in total, and about 4,500 of these issuers had their primary locations exposed to projected wind speeds greater than 50 knots. The issuers with primary locations exposed to these high wind paths were disproportionately in the technology and industrial sectors (Figure 3).
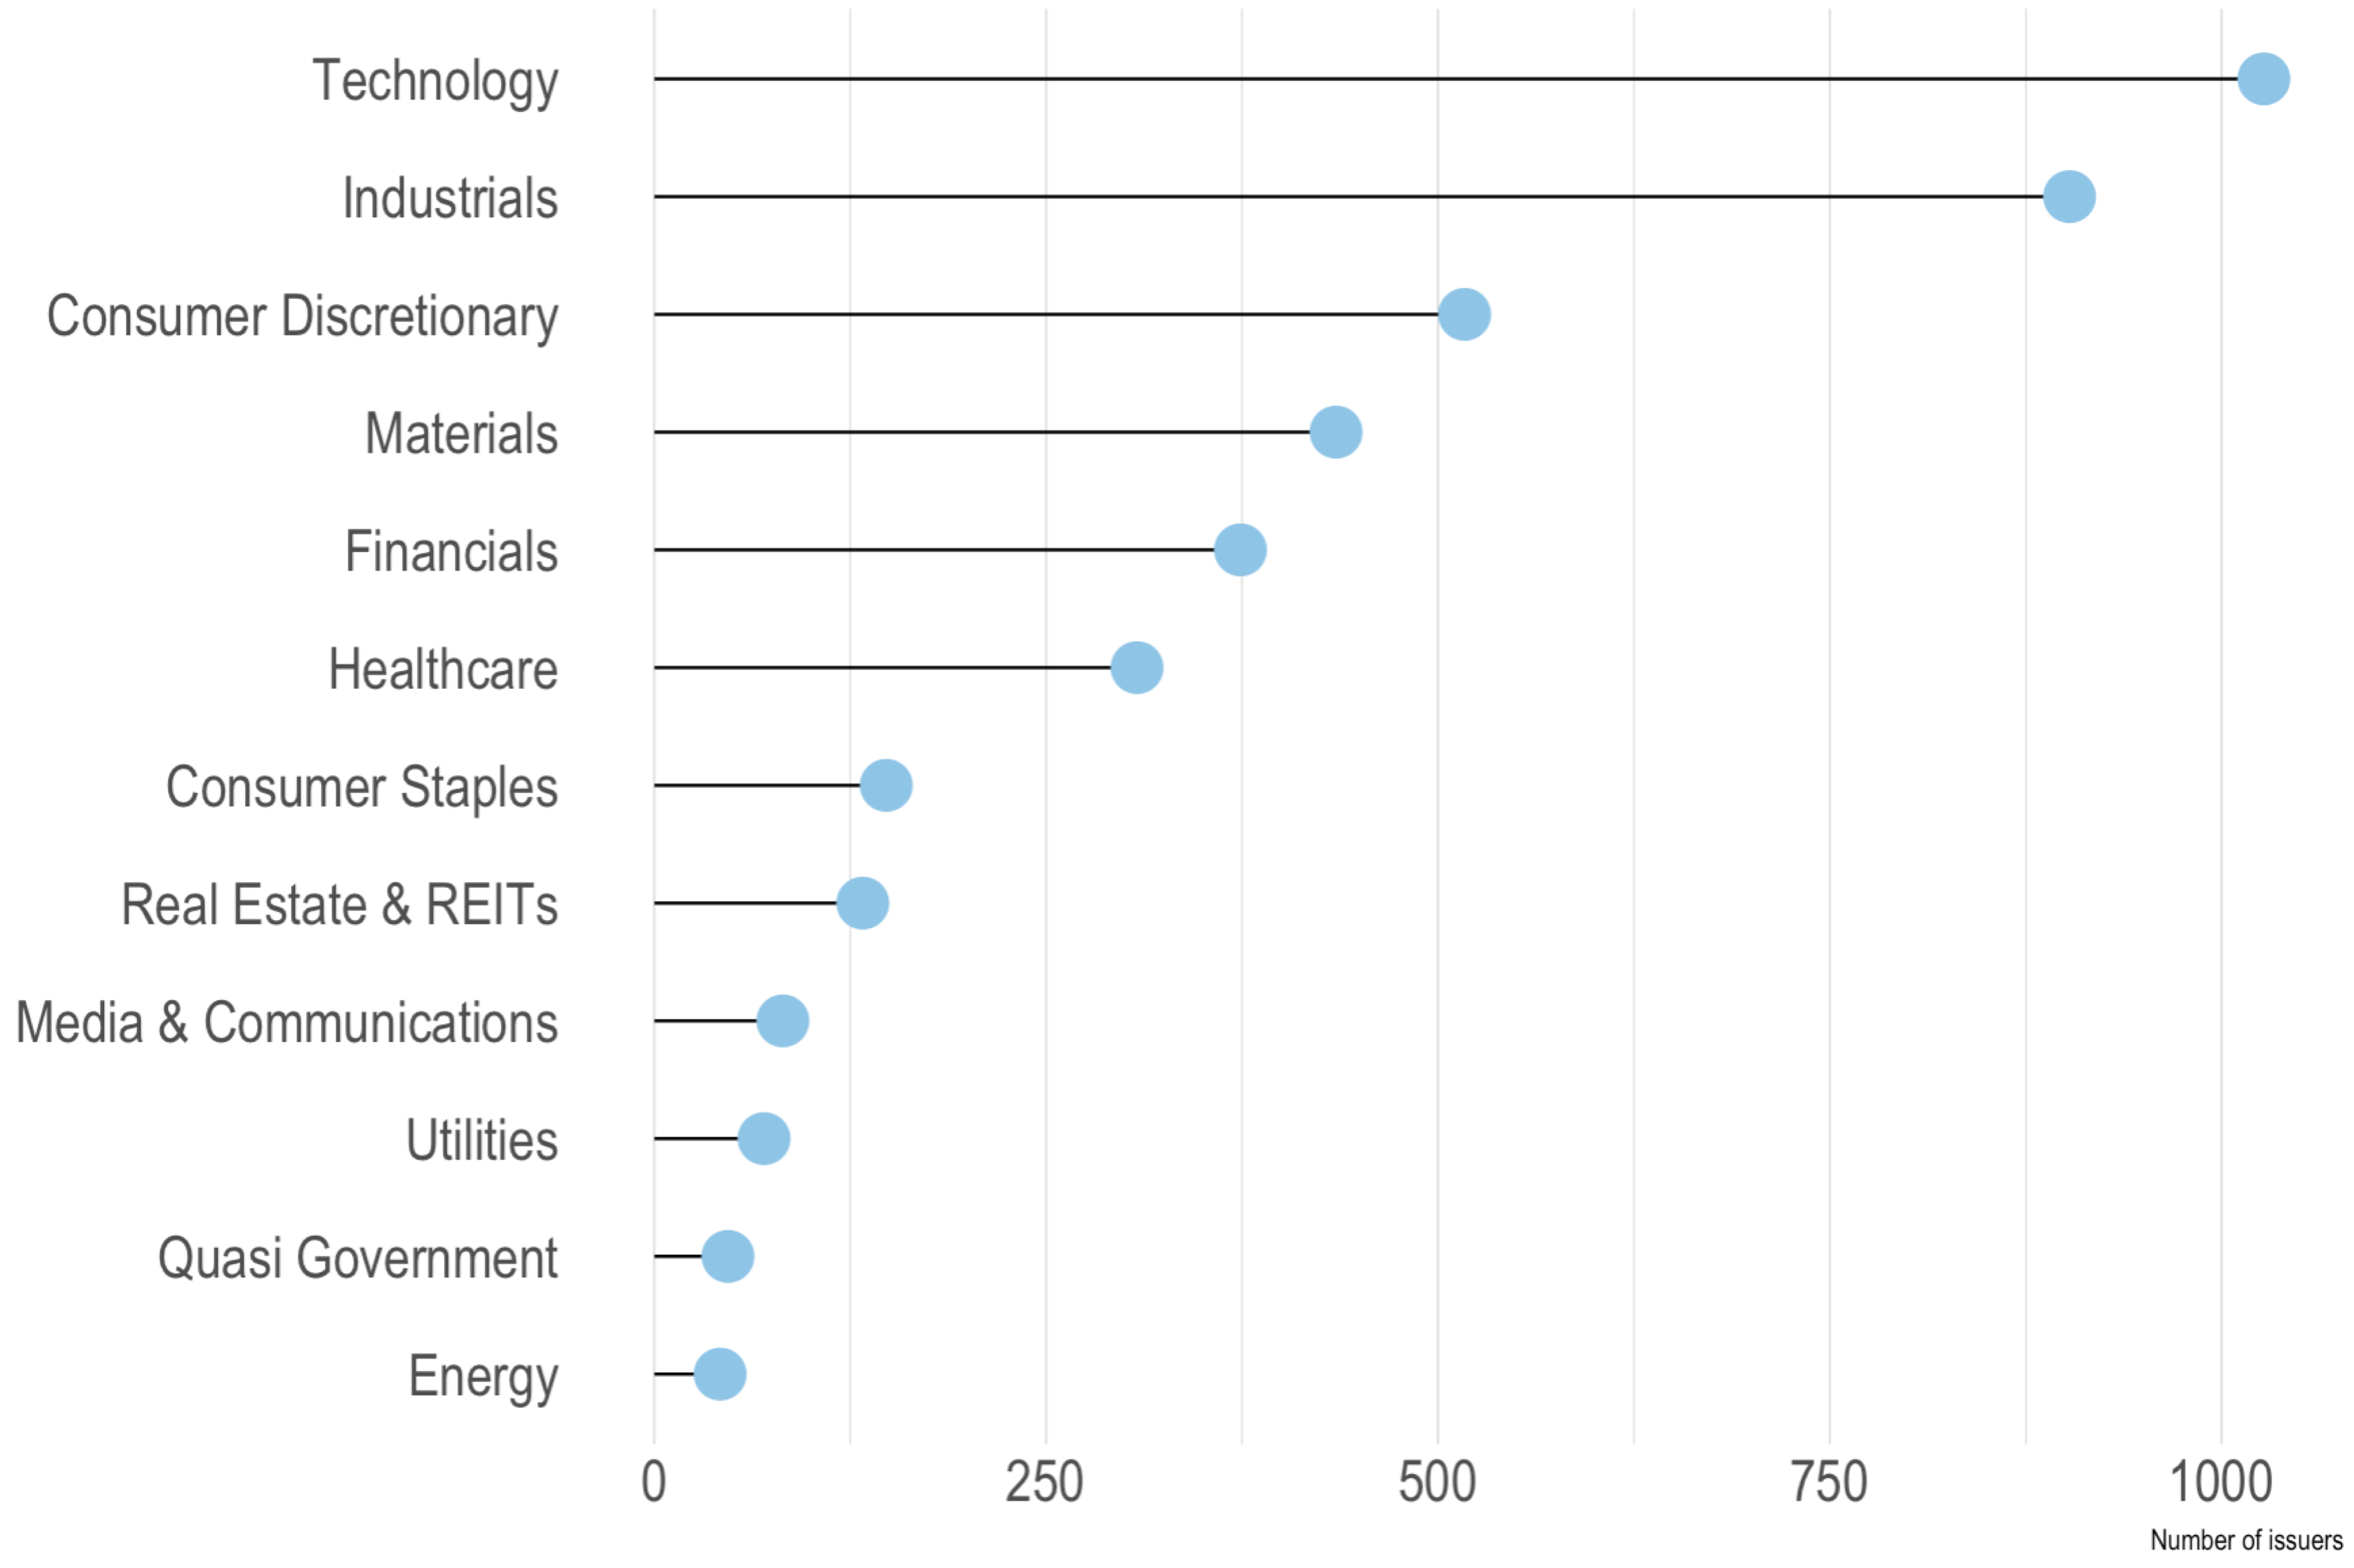
Figure 3: Sector breakdown of corporate debt issuers with primary locations exposed to high winds during 2024 western Pacific typhoon season (only sectors with more than 40 issuers are shown). Source: ICE as of 04/11/25.
ICE can link these debt issuers to live securities to provide investors with information about their exposure. Had these storms occurred in May 2025,8 for example, about 2,900 live corporate securities9 associated with issuers with primary locations in forecasted high wind zones would have been exposed. Many of these securities were not rated (more than 190 securities), have had ratings withdrawn (nine securities), or are in default (more than 50 securities). For investors in these kinds of already high-risk securities, information about imminent exposure to typhoons may be especially important.
Importantly, this same kind of analysis can be done for different kinds of hazards, including floods, earthquakes, droughts, and still higher winds speeds (greater than 64 knots; Figure 4) during tropical cyclones.
2024 Tropical Cyclones (wind speeds > 64 knots)
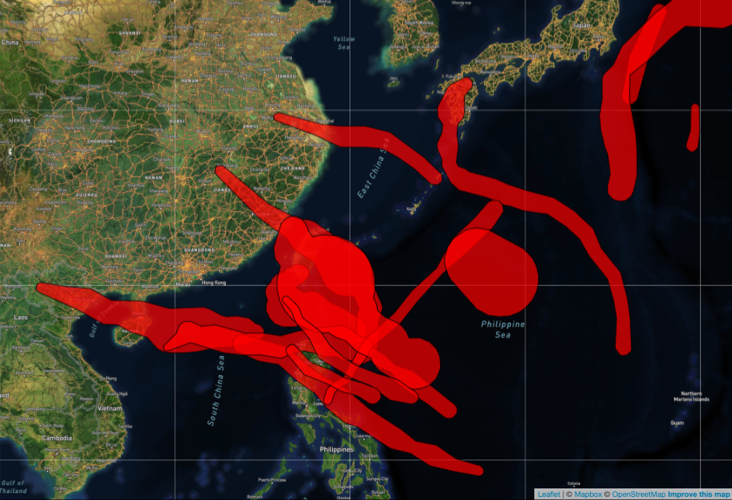
Corporate Exposure
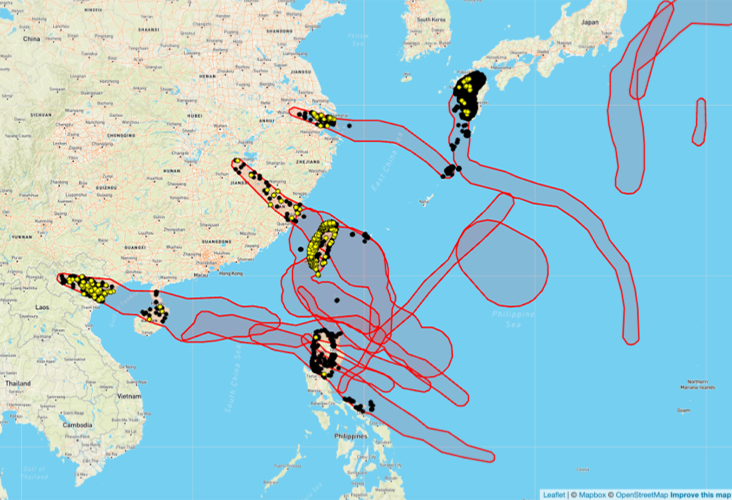
Figure 4: Corporate exposure to even higher wind speeds (greater than 64 knots) during the 2024 typhoon season in the western Pacific. Black dots are corporate asset locations in ICE Climate datasets; yellow dots are the primary locations of a corporate debt issuer. Source: ICE Climate and the Global Disaster Alert and Coordination System as of 04/10/25.
Finally, while these examples look at corporate exposure to past typhoons, one of the powerful aspects of this approach is that it can be applied to typhoon forecasts — providing investors and insurers with early warning about their potential exposure going forward.
- Reuters (18 August 2024). Toyota, Nissan, Honda, Mazda idle plants as powerful Typhon Shanshan near. Autonews. Available at: https://www.autonews.com/manufacturing/typhoon-shanshan-toyota-nissan-honda-idle-production-japan/
- Myles, P. (30 August 2024). Typhoon Shanshan piles more production woes onto Toyota. Wardsauto. Available at: https://www.wardsauto.com/toyota-motor/typhoon-shanshan-piles-more-production-woes-onto-toyota
- Kumar, A. (30 August 2024). Typhoon Shanshan disrupts Japan: Factories closed, 3 dead. Top updates. Business Standard. Available at: https://www.business-standard.com/world-news/typhoon-shanshan-disrupts-japan-factories-closed-3-dead-top-updates-124083001055_1.html
- Li, K. (9 September 2024). Super Typhoon Yagi wreaks havor in Asia. Semafor. Available at: https://www.semafor.com/article/09/08/2024/super-typhoon-yagi-asia-global-supply-chain-affects
- Zhuo, A. (13 September 2024). Super Typhoon Yagi causes USD56 million of damage to 12 listed firms in China’s Hainan. Yicai Global. Available at: https://www.yicaiglobal.com/news/twelve-chinese-companies-rack-up-losses-of-usd56-million-due-to-typhoon-yagi
- Hanh, V. N. (September 18, 2024). Impact of Typhoon Yagi on Vietnam: Economic Damage and Recovery Efforts. Vietnam Briefing. Available at: https://www.msn.com/en-us/money/news/taiwan-semiconductor-shares-dip-in-premarket-as-typhoon-kong-rey-brings-severe-disruptions-to-taiwan-s-infrastructure/ar-AA1tgnUV
- 7 Neuro, B. (31 Oct 2024). Taiwan Semiconductor Shares Dip in Premarket As Typhoon Kong-rey brings severe disruptions to Taiwan’s infrastructure. Benzinga. Available at: https://www.benzinga.com/news/24/10/41647779/taiwan-semiconductor-shares-dip-in-premarket-as-typhoon-kong-rey-brings-severe-disruptions-to-taiwan
- 8 As of May 2, 2025
- 9 Only live corporate bond securities with ISINs in ICE reference data are included in this count.
Related resources
- See moreClimate Risk
Our climate risk data experts analyze the risks and opportunities in markets, and the extent to which physical and transition risk is being priced into portfolios and assets.