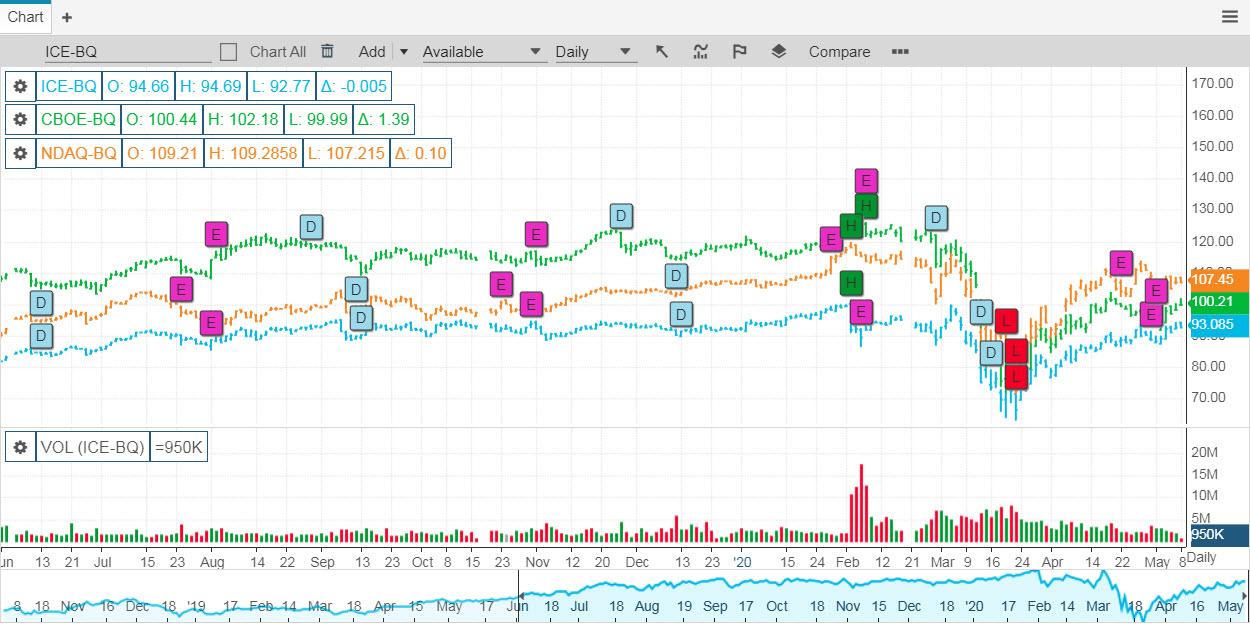
The chart widget is a sophisticated charting tool consisting of many studies and functionalities.
Embed the chart widget to view real-time and delayed, intraday and historical data, with a variety of plot types, drawing tools, technical indicators, and overlays such as corporate actions and peers.

The chart widget is a sophisticated charting tool consisting of many studies and functionalities. The charts allow a user to view multiple symbols overlayed and provides an easy way to change the time frame to really hone in on the data. Tools to draw within the charting tool are available as well as the ability to display flags for data points the user is interested in. On top of that, the chart includes a robust collection of studies.
For more information about the Chart or any of our widgets reach out to our Sales team.


