
LA fires a climate inflection point for muni investors
ICE data reveals LA County bond investors directly pricing in climate risk for first time
This article first appeared in The Bond Buyer
- The LA wildfires marked one of the first substantial municipal bond market reactions to a natural disaster
- The event raises broader questions about whether investors will begin assessing climate risks in their municipal portfolios
- ICE’s geospatial library shows over 140 municipal entities were exposed to the fires, linked to ~7,400 individual municipal securities
The wildfires that devastated Los Angeles in January 2025 marked perhaps the first instance of a rapid and substantial municipal bond investor reaction to a natural disaster. Even before credit rating agencies downgraded LA bond issuers, securities sold off and bond spreads widened significantly as the severity of the conflagration became apparent to debt holders.
The Palisades and Eaton fires burned more than 37,000 acres, or nearly 60 square miles, destroyed between 14,000 and 16,000 structures, including homes, businesses and schools, and took the lives of at least 28 people, becoming one of the costliest natural disasters to ever hit the United States (see Figure 1). 1, 2
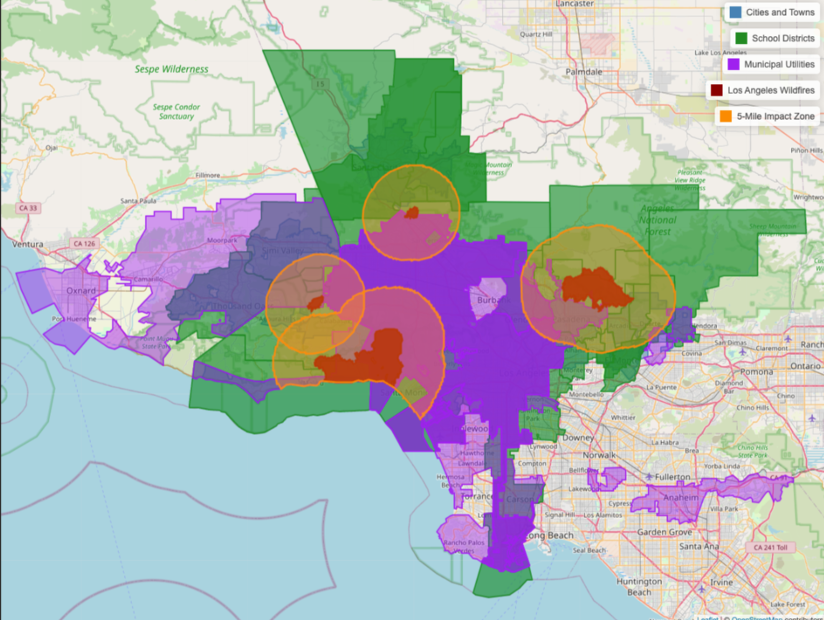
Figure 1. Full extent of the Palisades, Eaton, Hurst and Kenneth Fires and impacted cities, towns, school districts and municipal utilities in southern California counties. Source: ICE Climate
The fires have led many to ask whether the market is now approaching a tipping point where investors finally begin to assess climate risks in their municipal portfolios more broadly. For a market that has historically been slow to react to natural disasters, to technology, to change in general, the price and yield adjustments this time around have been striking.
In the days following the initial spread of the fires, secondary market trading of Los Angeles Department of Water and Power (LADWP) bonds – highly-creditworthy and relatively liquid securities – began to increase. The spread between LADWP bond yields and the yields on a generic AAA municipal bond index also widened considerably (see Figure 2).
Figure 2. Los Angeles Department of Water & Power bond yields rose sharply between 1/2/2025 (before the southern California wildfires) and 2/12/2025 (post-fires). Yields on a generic AAA municipal bond index barely moved over the same period. Source: ICE Climate
ICE Data Services, which has built indices and yield curves around vast amounts of climate data, has monitored secondary movements following various severe-weather related events over several years. The wildfires marked the first time, however, that ICE analysts observed municipal bond spreads widening in direct response to a climate-related event.
“We’ve had climate risk data available to us in muni bond evaluations for some time, and though we have observed wide variations in risk, the market has paid little attention to climate until now,” said Patrick Smith, Senior Director, Municipal Evaluations at ICE Data Services. “Previous climate-related disasters have provoked little, if any immediate reaction in the muni market. Bond issues impacted by the Paradise fire five years ago, or more recently the devastating hurricanes in Florida and North Carolina, were mostly unchanged in the immediate aftermath of these events.”
LADWP tax-exempt bonds widened 40 to 60 basis points relative to ICE’s benchmark AAA Muni Curve, a dramatic shift in a market that typically doesn’t see yield movements of that size in even the most volatile of conditions. The cost to bond issuers is significant: a 50-basis point rise in borrowing costs could add as much as $500,000 per year in additional debt service on a $100 million bond issue.
The ratings reaction was also swift. S&P Global Ratings was the first credit agency to lower its long-term and underlying ratings on the LADWP on January 14 and the agency put the city of Los Angeles’ general obligation bonds on negative credit watch soon after.
Other agencies followed, with negative credit watches and downgrades to LADWP as well as Southern California Public Power Authority, which has projects tied to LADWP, and Utah's Intermountain Power Authority, also closely linked to LADWP. Smaller governments and power agencies have also received ratings downgrades and credit watches as the full picture of the damage has emerged.
For issuers that have asked the market for a pricing differential for disclosing their risks or labeling their debt issuances as green or resilient, the answer may now be: when will you start seeing pricing penalties for not making such climate risk disclosures?
“The wildfires should have portfolio managers looking at their portfolios and asking themselves what else is lurking in there that could pose hidden climate risk?” said Smith. “I don't think anyone is shocked that southern California had wildfires, but the extent of the damage is pretty astonishing. And I think the market was surprised by that and then realized that some of the revenue base would be negatively impacted.”
While valuations of the fire-impacted issuers’ credits have stabilized, many in the market believe both investors and ratings agencies need to use the LA wildfires as the impetus to dig further into risks. An analysis of ICE’s municipal bond reference and geospatial data identified 20 school districts and 17 cities that are exposed to the Palisades and Eaton fires, with a combined total of $59 billion of debt outstanding.
ICE’s Climate Physical Risk Data applies geospatial climate, economic and demographic data to specific municipalities, MBS pools, and related fixed income securities. Its geo-analyzer looks at climate and social features surrounding any specific location within the U.S., regardless of the presence of any linked security. Across all sectors of the market, ICE’s geospatial library shows that more than 140 municipal entities may be exposed to the LA fires, linked to about 7,400 individual muni securities.
Smith, along with Nick Peters, Product Director at ICE Data Services, said that the tools ICE has built aim to not only monitor the secondary market movements, provide evaluations and pricing services, but also arm investors with layers of climate data on U.S. municipal credits coast to coast.
“Before LA, parsing through ICE’s pricing and reference data and trying to unwind it all to make an inference about whether a particular security was priced or traded differently because of climate risk – or even as a direct result of the effects of it – was been really hard to do with any level of causation,” said Phoebe Devries, Senior Manager Research & Content at ICE Climate.
The idiosyncratic nature of the municipal market - with its various securitized revenue streams, backstops and taxing power of government issuers, the role of the Federal Emergency Management Agency (FEMA) and the extremely low default rates of the market overall - have kept most investors less concerned about weather event impacts, Devries noted.
The climate data is vast and concerning, nonetheless. Nearly 25% of U.S. bridges built before the 1960s are vulnerable to climate stresses like extreme heat and heavier rainfall. Coastal regions face rising sea levels and storm surges, requiring sea walls, flood barriers, elevated roadways, and improved drainage systems, while drought-prone areas need advanced infrastructure to mitigate water scarcity impacts.
And as 100-year storms and severe weather events occur with more frequency and intensity, the costs to upgrade infrastructure – sometimes 100 years old itself – becomes ever more pressing. In addition to the risks of natural disasters, threats to the current structure and role of FEMA have materialized and called into question whether a federal backstop will be there in the future.
Many municipalities are going to need to re-stabilize their infrastructure and will require a municipal bond market capable of absorbing those borrowing costs. The American Society of Civil Engineers estimates that overall U.S. infrastructure expenditure needs over the next 10 years will amount to around $7.5 trillion, financing that needs to be sourced in a market that only saw $500 billion in issuance last year.3
All of this is taking place amidst another immediate and mounting U.S. financial stress: the dwindling availability and soaring cost of home insurance. Many U.S. property and casualty insurers have already exited California due to wildfire risk and more are now likely to follow suit.
California’s already beleaguered state-backed FAIR Plan fire insurance program has seen its residential insurable fire exposure grow from $153 billion in 2020 to $458 billion in 2024. Of this, $5.9 billion is concentrated in the Pacific Palisades.
The final toll of the destruction in Los Angeles has yet to be fully accounted, and many unanswered questions remain about the infrastructure to be rebuilt, or whether it will all be ultimately replaced.
There are particularly pointed questions around charter schools, healthcare facilities, nursing homes and continuing care retirement communities – already higher-risk investments – that may not make sense to rebuild in their current locations.
“I would ask questions about where services are provided that are revenue dependent to pay their debt,” said Peters. “People are going to want to rebuild a school where they live, but it might not make economic sense to rebuild a hospital that was already old in the same spot if there's another service provider nearby. I'd be looking at my revenue bonds in those endangered areas, specifically charter schools, hospitals, nursing homes, things along those lines.”
If the LADWP or other providers are found to be even partially liable, how much of that cost is going to be borne by the existing rate payers, and how quickly are they going to be able to rebuild and re-establish those customer revenues?
“There are a lot of unanswered questions: is LA going to become a place of desolation? Are people going to stop going there, working there, living there? No, they'll rebuild, but the situation begs investors to ponder the question: what else is lurking in my portfolio that I should be looking at?” concludes Smith.
Explore our solutions
Quantifying climate risk and opportunities in fixed income and real estate.