Carbon transition risks: what municipal bond investors need to know
Risks and opportunities associated with the energy transition could broaden as more communities shift away from carbon-intensive industries
- The carbon transition, and the move away from coal in particular, has already had profound economic effects on local communities across the U.S.
- Few U.S. municipalities release sustainability-related reporting, creating a challenge for investors who want to assess carbon transition risks in the municipal market.
- To address this, ICE Climate recently developed Scope 1, 2, and 3 emissions estimates for municipalities and municipal bond obligors across the country.
Since 2015, more than 150 coal-fired power plants have been retired in the United States.1 The scale of the impacts of this shift away from coal are difficult to overstate. Nationwide, between 2008 and 2016, the number of coal-mining jobs decreased by over 40% and fossil fuel power plant jobs decreased by over 30%.2 The economic impacts have been particularly profound in local communities that depended on coal mines and power plants for employment.
Coconino County, Arizona faced $40 million in recurring annual property tax losses when its Navajo Generating Station closed in 2019.3 The same year, the local unemployment rate more than doubled in Nucla, Colorado with the closure of a nearby coal-fired power plant.4 The decline in coal production and processing has had particularly widespread effects in Eastern Kentucky, where 13,000 coal industry jobs disappeared between 2011 and 2018.5 These types of local and regional repercussions are likely to continue; the Department of Energy projects that at least 29 additional U.S. coal-fired power plants will close by 2030.6
The federal government recognized the hardships being endured by traditionally fossil fuel industry-dependent communities in the Inflation Reduction Act (IRA), targeting tax credits to clean energy projects in these areas. Under the 2022 law, 'traditional energy communities' are identified based on a combination of unemployment and tax revenue statistics, locations of former industrial sites, and locations of recently closed coal mines or retired coal-fired electric generating units. These energy communities are concentrated in Appalachia, Wyoming, Utah, and Montana (Figure 1). To date, these are the regions of the country that have borne the brunt of the economic impacts of the carbon transition, but, going forward, they also may benefit from clean energy projects due to the law’s tax incentives.
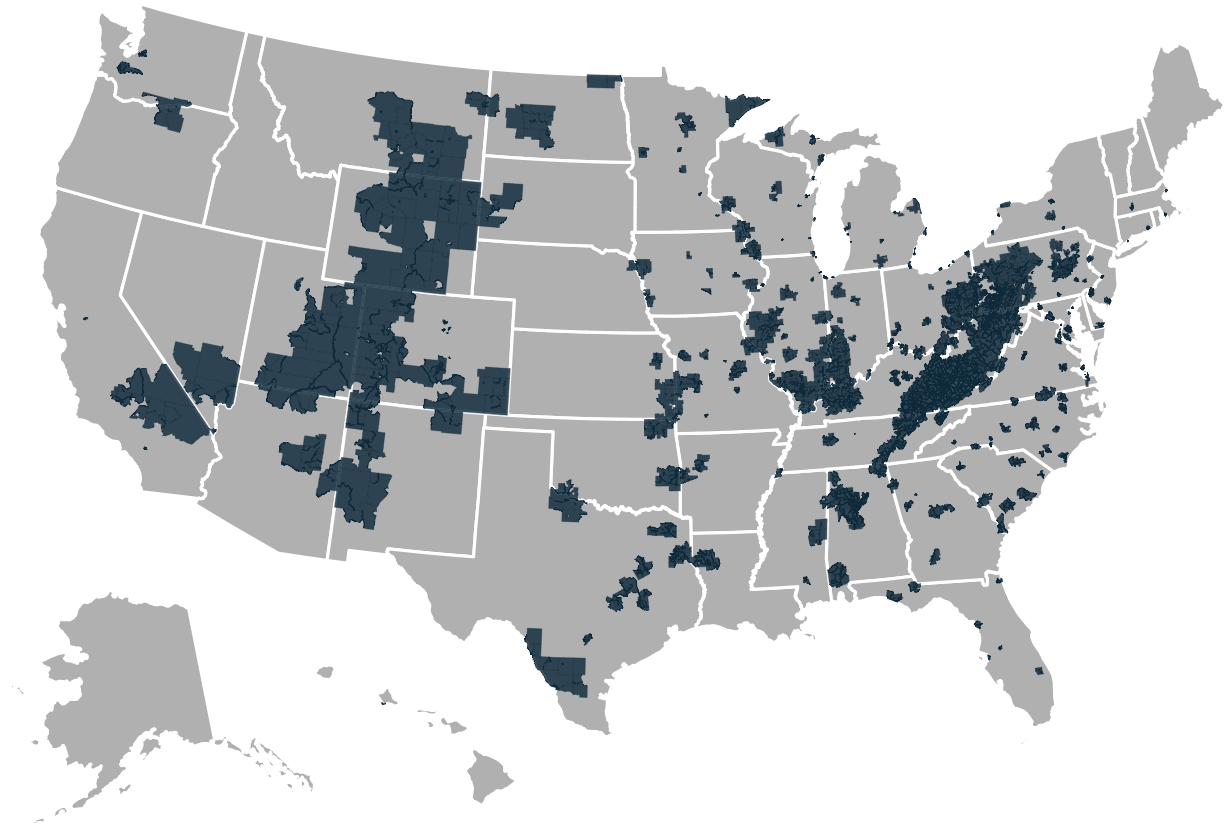
Figure 1. Traditional energy communities identified by the 2022 Inflation Reduction Act. Source: National Energy Technology Laboratory Energy Data Exchange as of Nov 1, 2024.7
Going forward, these kinds of risks and opportunities associated with the carbon transition are likely to broaden. Municipalities with high greenhouse gas footprints may face public pressure, regulatory penalties, or incentives aimed at reducing their emissions, whether the emissions are:
- Scope 1: emissions produced directly within the municipality’s boundaries
- Scope 2: emissions produced via purchased energy use
- Scope 3: emissions enabled indirectly through consumption of goods and services
Emissions-related penalties and incentives could impact local businesses’ operating costs and the costs of living for residents — as well as potentially shift investor perceptions of risk, and raise the cost of borrowing for some municipal governments. These added costs could in turn affect the financial health of neighborhoods, towns, cities, and states. Ultimately, many of the country’s 'highest-emissions communities' communities may become the 'traditional energy communities' of the future.
For individual communities, the risks and opportunities associated with the transition to a lower-carbon economy translate into risks and opportunities for municipal bond market investors. However, in the past it has been difficult to assess transition risks systematically in the municipal bond market context.
The challenge of assessing transition risks in the municipal bond market
In most major asset classes, investors rely on sustainability-related reporting from corporations and national governments to assess carbon transition risks. However, U.S. municipalities rarely issue such reports, creating a significant gap in data needed to evaluate carbon transition risks for the municipal bond market.
Over the past year, ICE Climate has bridged this gap by developing emissions estimates for municipalities, broken down by Scope 1, Scope 2, and Scope 3. These estimates are obligor-specific and derive from third-party data using ICE Climate’s advanced downscaling and re-aggregation methodologies.
Ultimately, the transition risk metrics include total emissions, emissions per capita, and emissions per dollar of local gross domestic product (GDP). Each measure of emissions is useful in its own way — total emissions represent the bulk emissions footprint of a community, while emissions per capita and per dollar GDP enable comparisons and target-setting across many different securities. ICE Climate provides these emissions estimates for 92% of outstanding municipal debt, as well as for thousands of towns, cities, and school districts that currently carry no debt.
What can these transition risk metrics tell us?
While 'traditional energy communities' — those that have historically been at the forefront of the carbon transition — are geographically concentrated in certain areas, high-emissions communities are distributed across the country.
Total Emissions (Mtons)
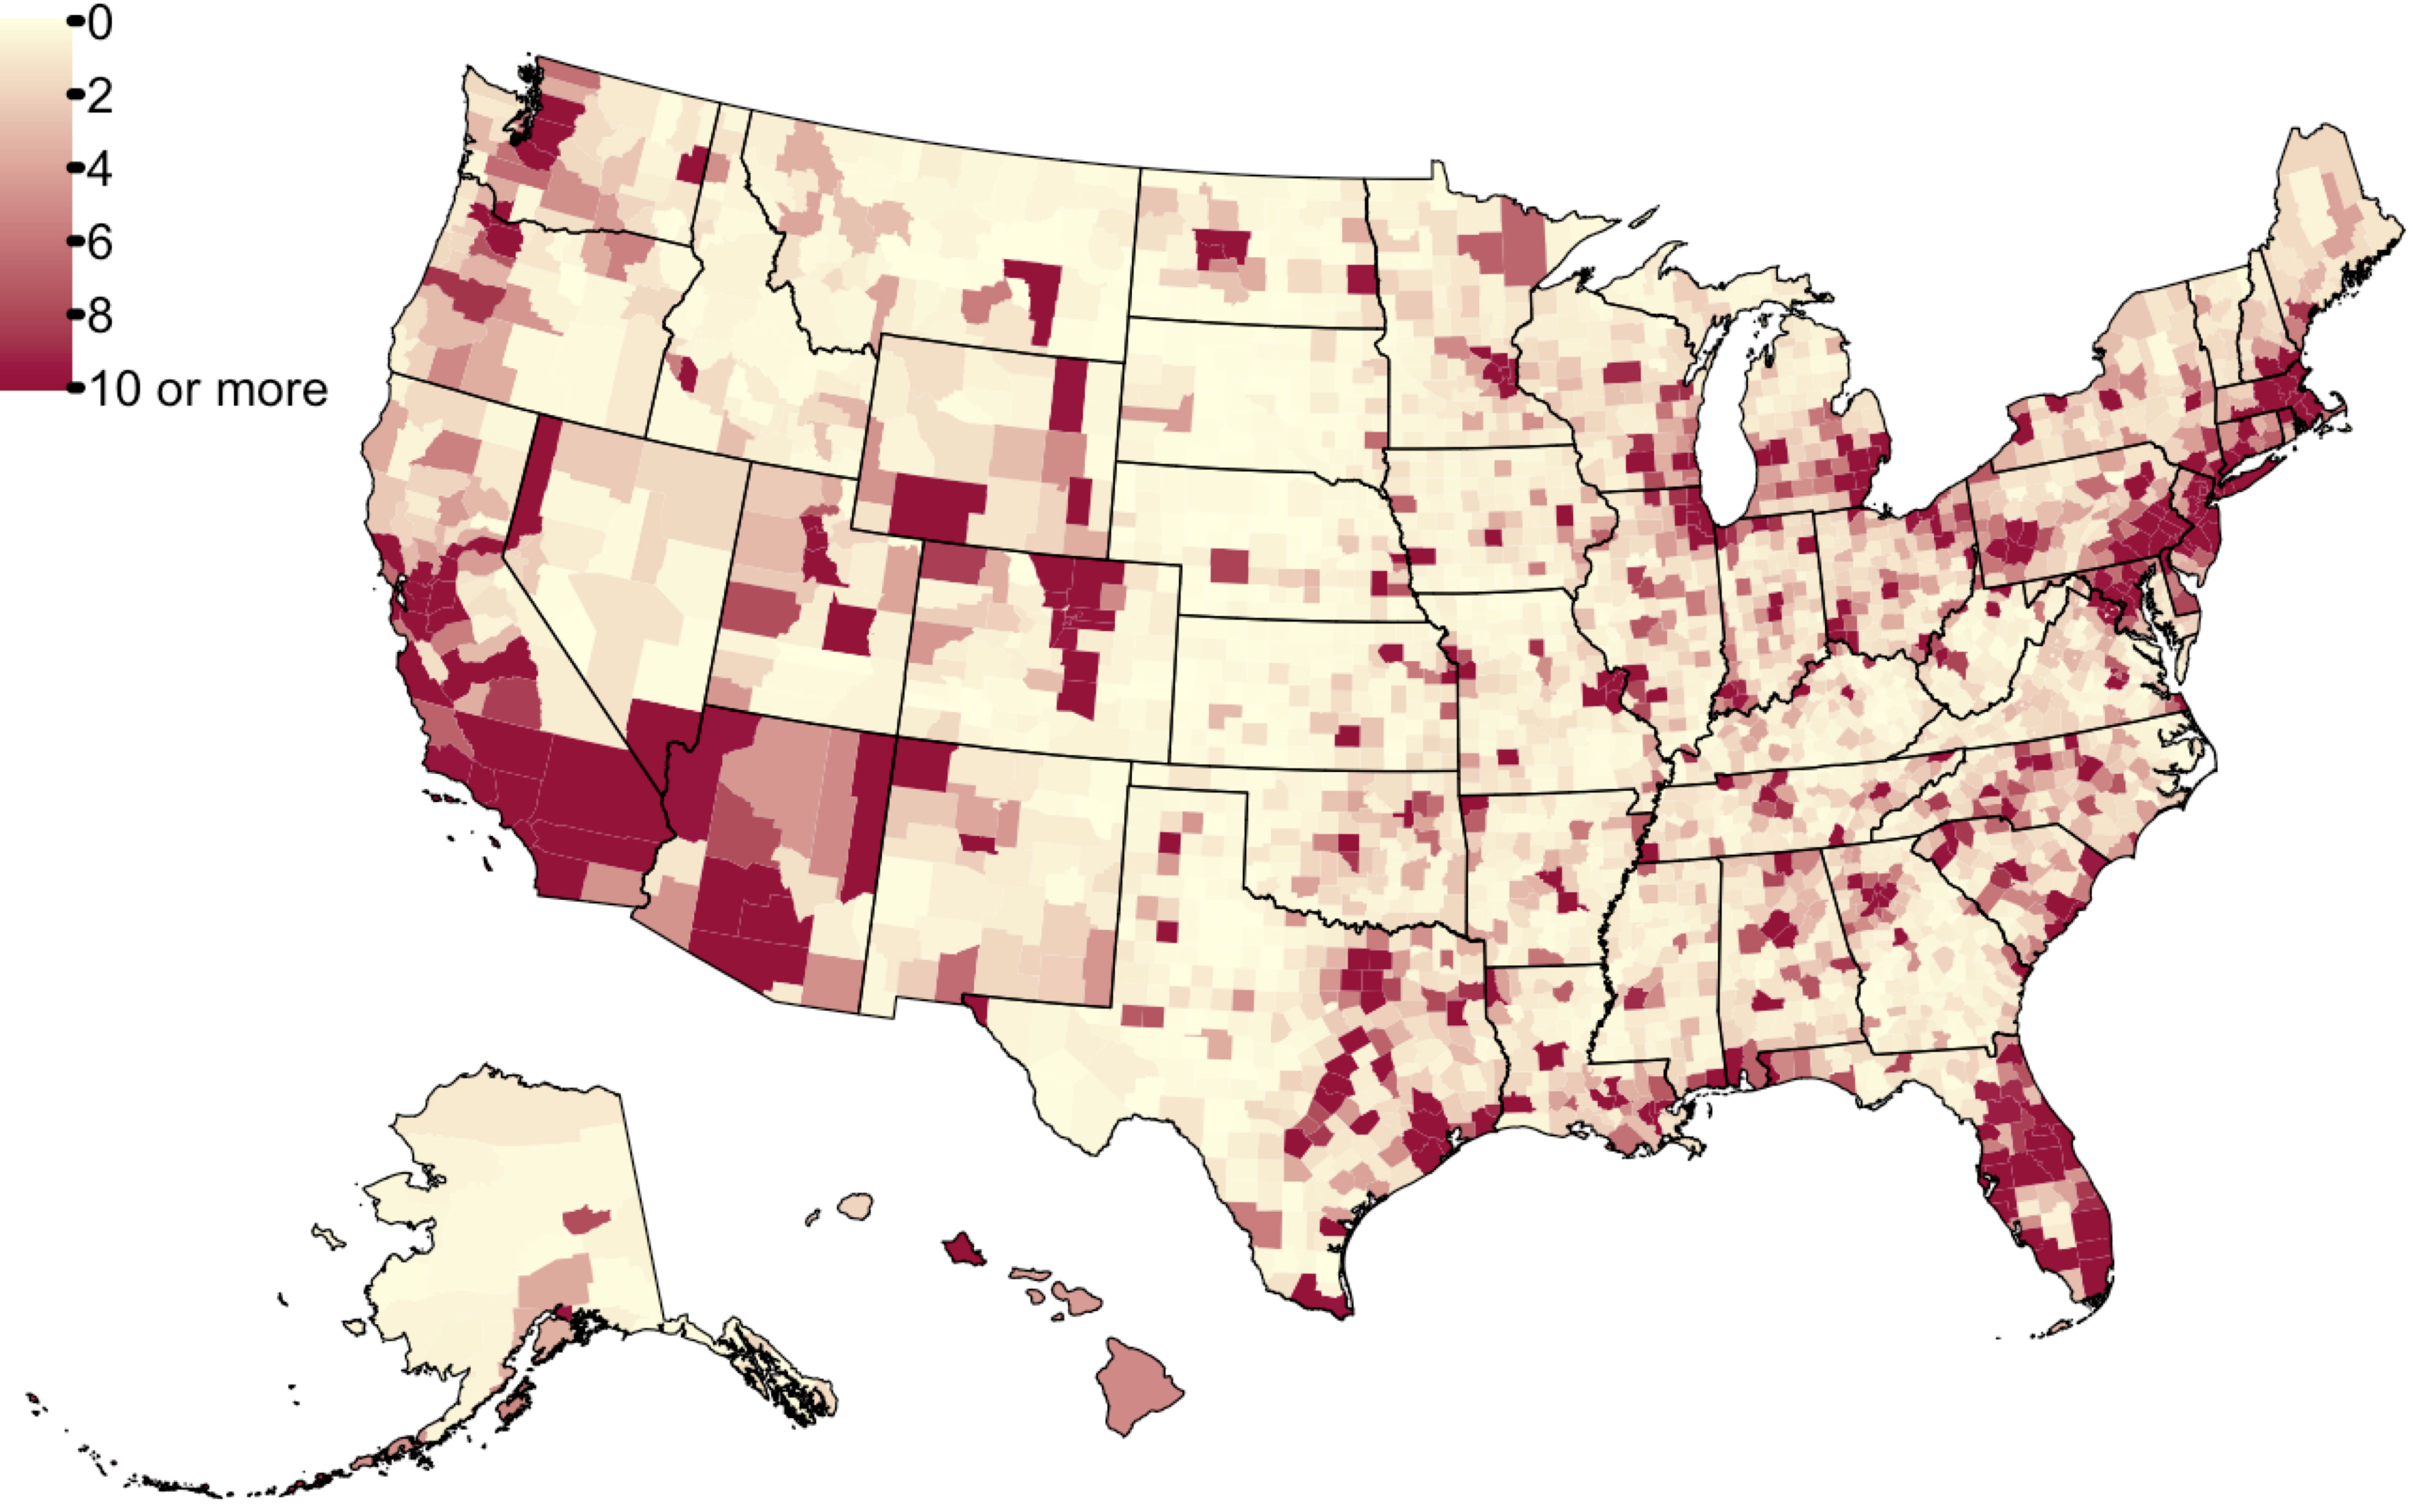
Total Emissions Per Capita (tons/person)
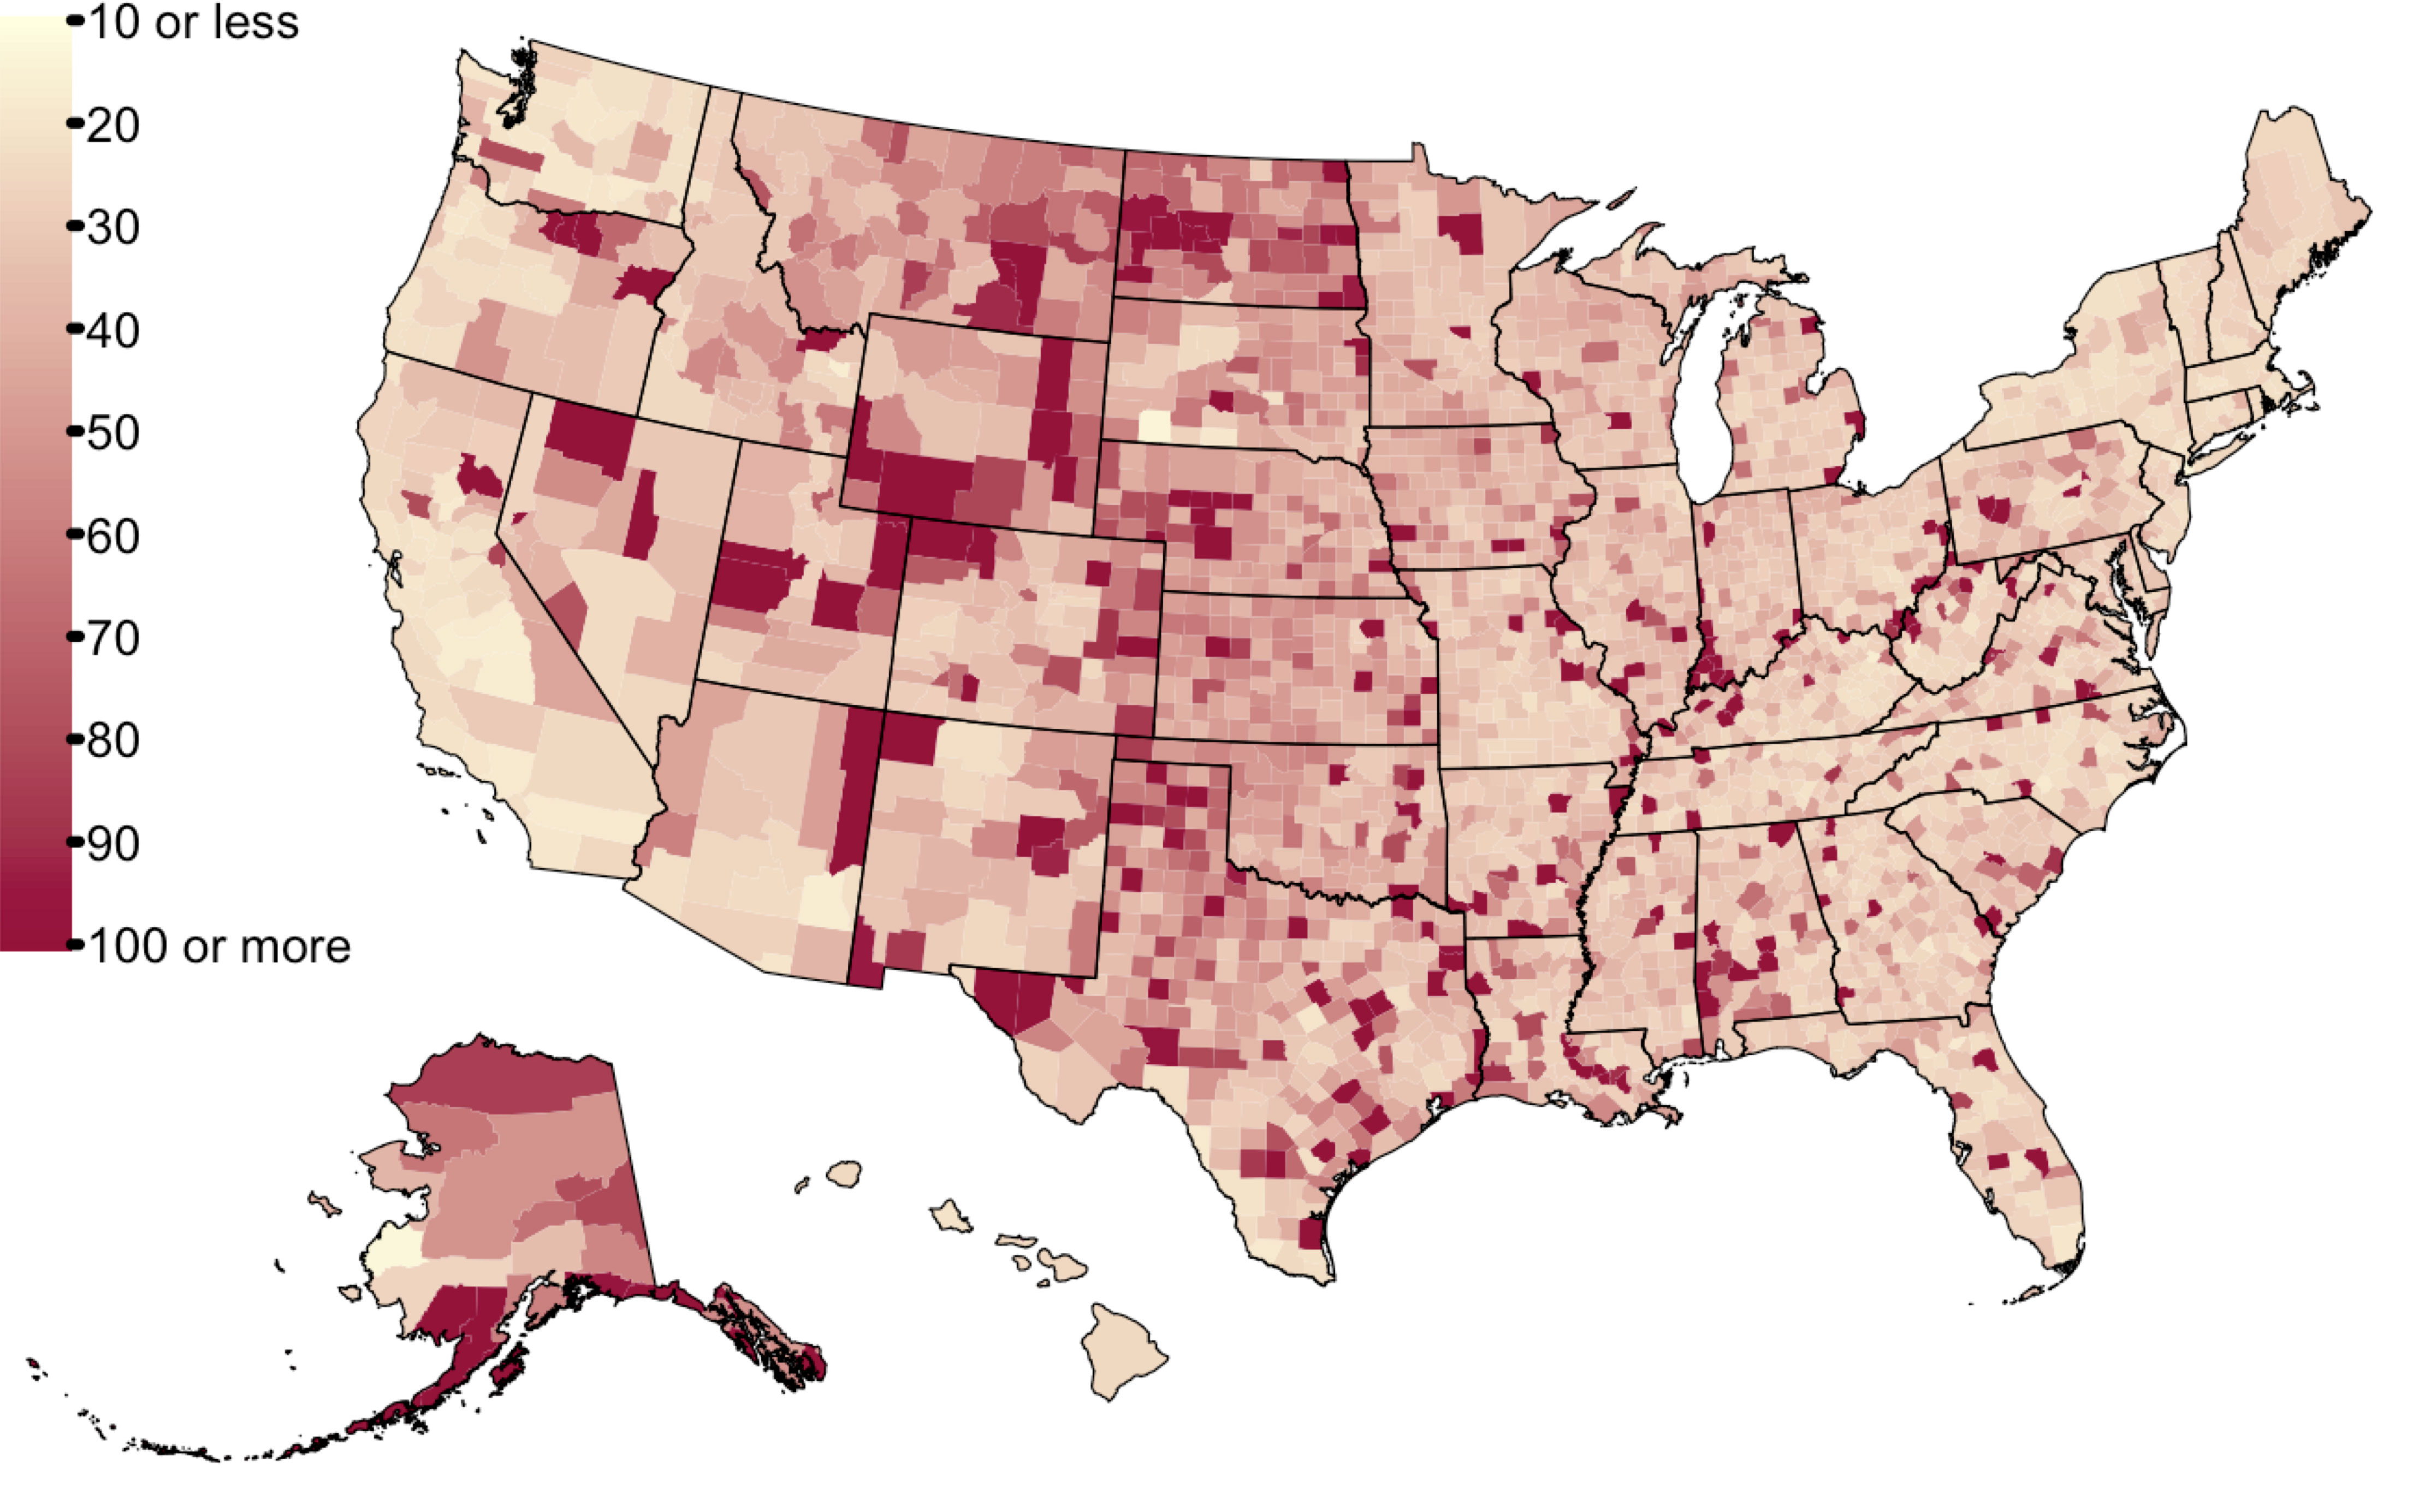
Figure 2. (Top) Total emissions estimates (Scope 1, 2, and 3) by county and (Bottom) total emissions estimates per capita by county. Source: ICE Climate as of Nov 1, 2024.
Depending on the context, measuring municipalities’ emissions in a way that takes population density or economic activity into account (emissions per capita or emissions per dollar GDP) may be more informative. In the sections to follow, 'high-emissions communities' communities are identified based on their emissions per capita (e.g., Figure 2, bottom).
The highest-emitting 5% of counties are spread across almost every state (Figure 3). Texas leads with the largest number of residents in these high-emission counties, followed by California, Illinois, and Florida.
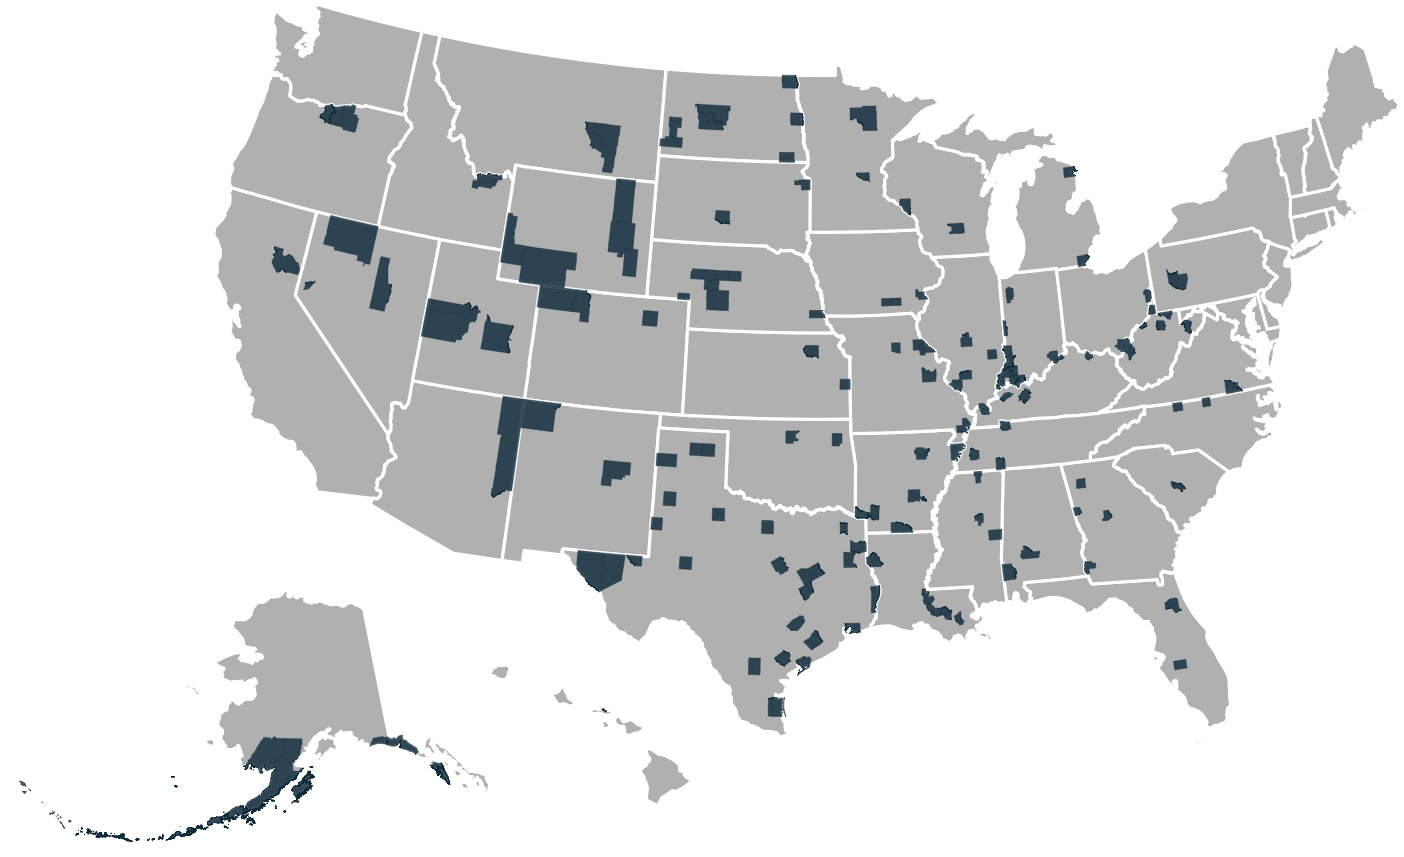
Figure 3. High emissions per capita communities (counties in top 5% for total emissions per capita nationwide) identified by ICE Climate. Source: ICE Climate as of Nov 1, 2024.
Total population in 5% highest-emitting counties by state
Figure 4. Estimates of the total population in the top 5% highest-emitting counties nationwide (per capita) by state. Source: ICE Climate as of Nov 1, 2024.
Not all high-emission communities face the same risks. A more granular look at the data reveals geographical and economic differences. For instance, the census tracts with the highest Scope 1 emissions per capita tend to be large, rural areas in the Western and Southwestern U.S., as well as more densely populated regions in the Southeast, Midwest, and Northeast. High Scope 2 emission communities are concentrated in the eastern half of the country, while Scope 3 emissions are most prevalent in urban centers where goods and services consumption are at their highest.
Top 5% of counties in terms of emissions per capita
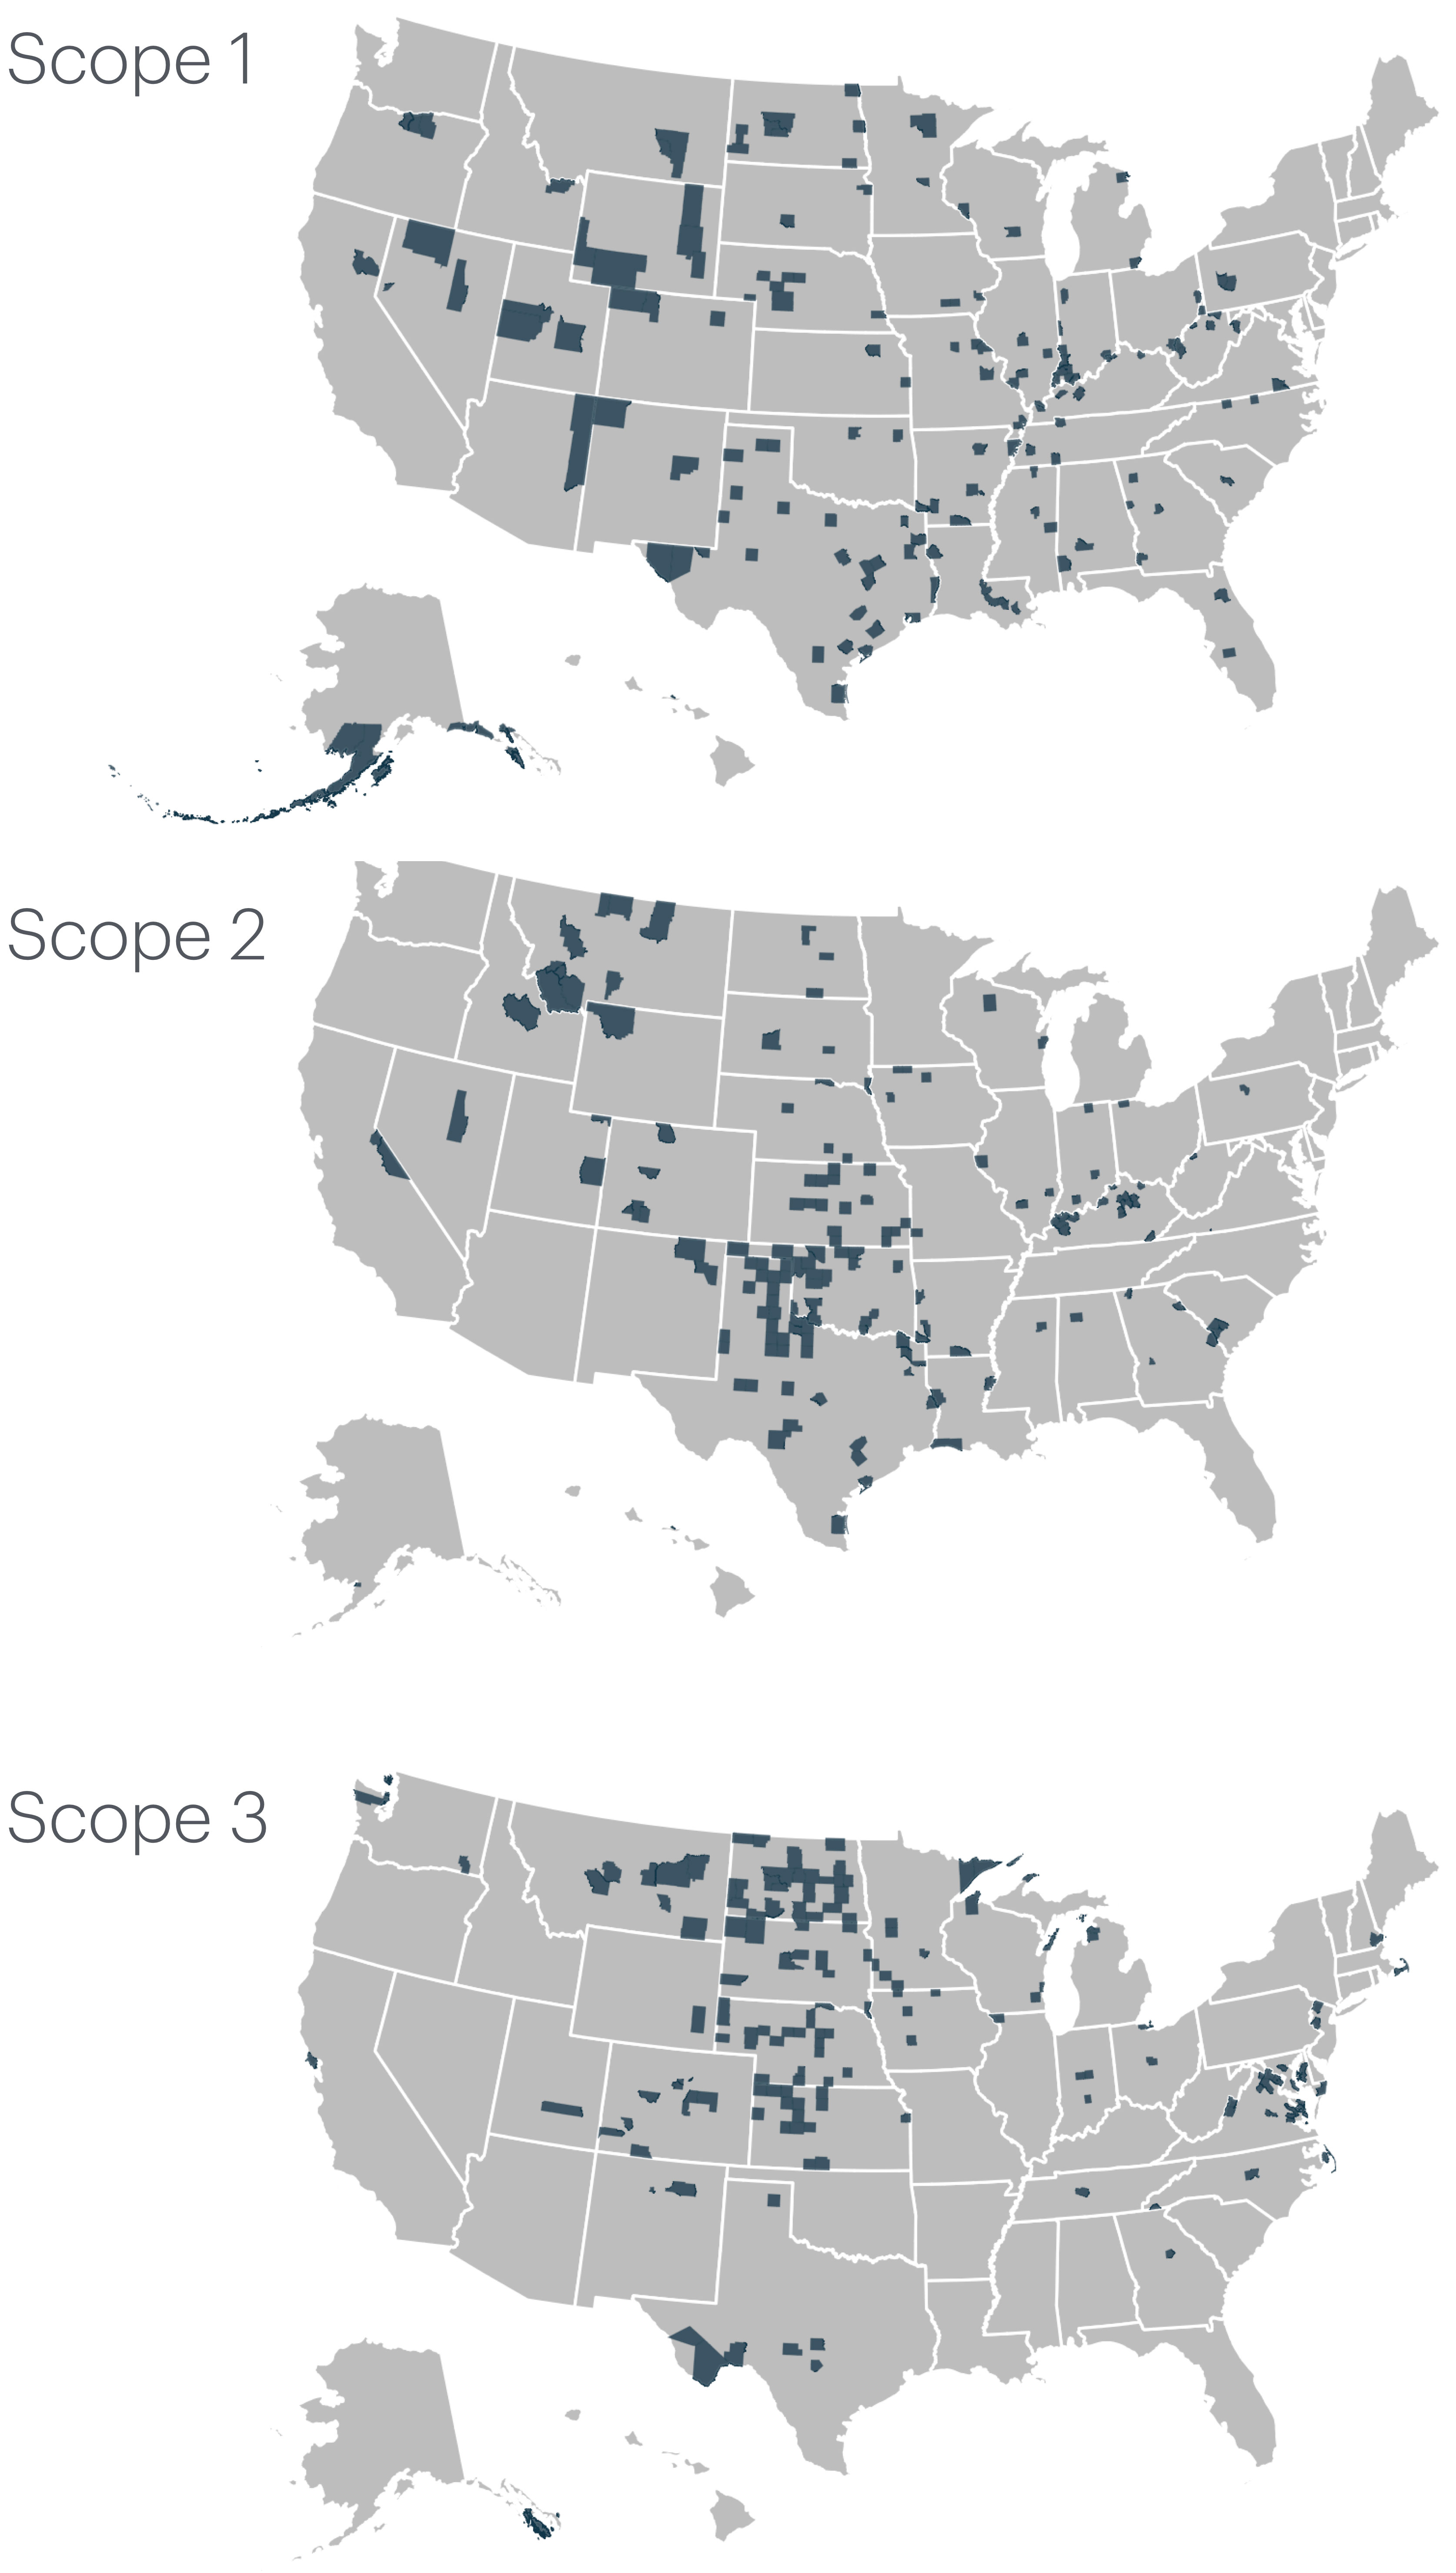
Figure 5. Counties with the top 5% of Scope 1 emissions per capita, the top 5% of Scope 2 emissions per capita, and the top 5% of Scope 3 emissions per capita. Source: ICE Climate as of Nov 1, 2024.
Some communities may be more vulnerable to transition risks than others
Looking forward, municipalities with high Scope 1, 2, and 3 emissions will be particularly vulnerable to transition-related costs and risks in the coming decades. Communities with high Scope 1 emissions may be hit hardest by new regulations, especially as fossil fuel plants and other high-emissions industrial operations close or are impacted by high transition costs. Areas with high Scope 2 emissions could face increasing electricity prices, while high Scope 3 communities may see a rise in the cost of carbon-intensive goods and services.
Not all communities will be affected equally. Across the U.S., over 2.7 million people live in high-emission census tracts where more than 20% of residents are below the poverty line. For these low-income areas, rising energy costs and inflation on essential goods could deepen financial struggles.
Looking forward
In the Inflation Reduction Act, the U.S. government identified traditional energy communities as areas of the country that have been negatively impacted by the carbon transition. ICE Climate’s transition risk metrics, by contrast, are forward-looking — providing stakeholders and investors with an understanding of the communities across the country that may face some of the largest (and smallest) transition-related costs in the future.
Ultimately, these risks should also matter to all investors. If the cost of carbon becomes more fully integrated into financial markets, high-emissions communities will likely pay the largest price. All stakeholders — issuers, investors, and residents alike — should be prepared.
1 Coal Power Plant Redevelopment Visualization Tool. U.S. Interagency Working Group on Coal & Power Plant Communities & Economic Revitalization, Department of Energy. Energycommunities.gov. Available here: https://energycommunities.gov/coal-power-plant-redevelopment-visualization-tool/
2 Jolley, GJ, Khalaf, C, Michaud, G, Sandler, A (2019). The economic, fiscal, and workforce impact of coal-fired power plant closures in Appalachian Ohio. Regional Science Policy and Practice, 11, 403-422.
3 Krupnick, M (26 Nov 2021). What happens when America’s coal plants die? The Guardian. Available at: https://www.theguardian.com/environment/2021/nov/26/what-happens-when-americas-coal-plants-die
4 Krupnick, M (26 Nov 2021)
5 Woods, B (31 Mar 2018). This Kentucky coal town is fighting for survival long after the war on coal is over. CNBC. Available at: https://www.cnbc.com/2018/03/29/the-kentucky-coal-town-fighting-to-survive-after-coal-mining-closings.html
6 Coal Power Plant Redevelopment Visualization Tool
7 U.S. Department of Energy (DOE), National Energy Technology Laboratory (NETL), Interagency Working Group on Coal & Power Plant Communities & Economic Revitalization (IWG, Section 48C Tax Credits - designated energy communities, 5/30/2023, https://edx.netl.doe.gov/dataset/section-48c-tax-credits-designated-energy-communities
Explore our solutions
Quantifying climate risk and opportunities in fixed income and real estate.