Forecasting financial exposure to billion-dollar hurricanes
A case study of the 2024 U.S. hurricane season
June 1, 2025
Key takeaways
- ICE’s Hazard Watch tool monitors and quantifies the exposure of fixed income securities to active extreme weather events in near real time.
- During the five large U.S. hurricanes of 2024, over 350,000 corporate asset locations, over 2,800 local municipal issuers, and about 11,000 properties in active commercial mortgage-backed security deals were exposed to high windspeeds.
- As the 2025 hurricane season begins, this tool will enable clients to understand imminent financial risks that may be material, actionable, and previously unappreciated.
Five hurricanes — Beryl, Debby, Francine, Helene and Milton — each caused more than $1 billion in damage in the United States in 2024.1 Over 300 people died due to these storms, making it the deadliest U.S. hurricane season since 2005.2
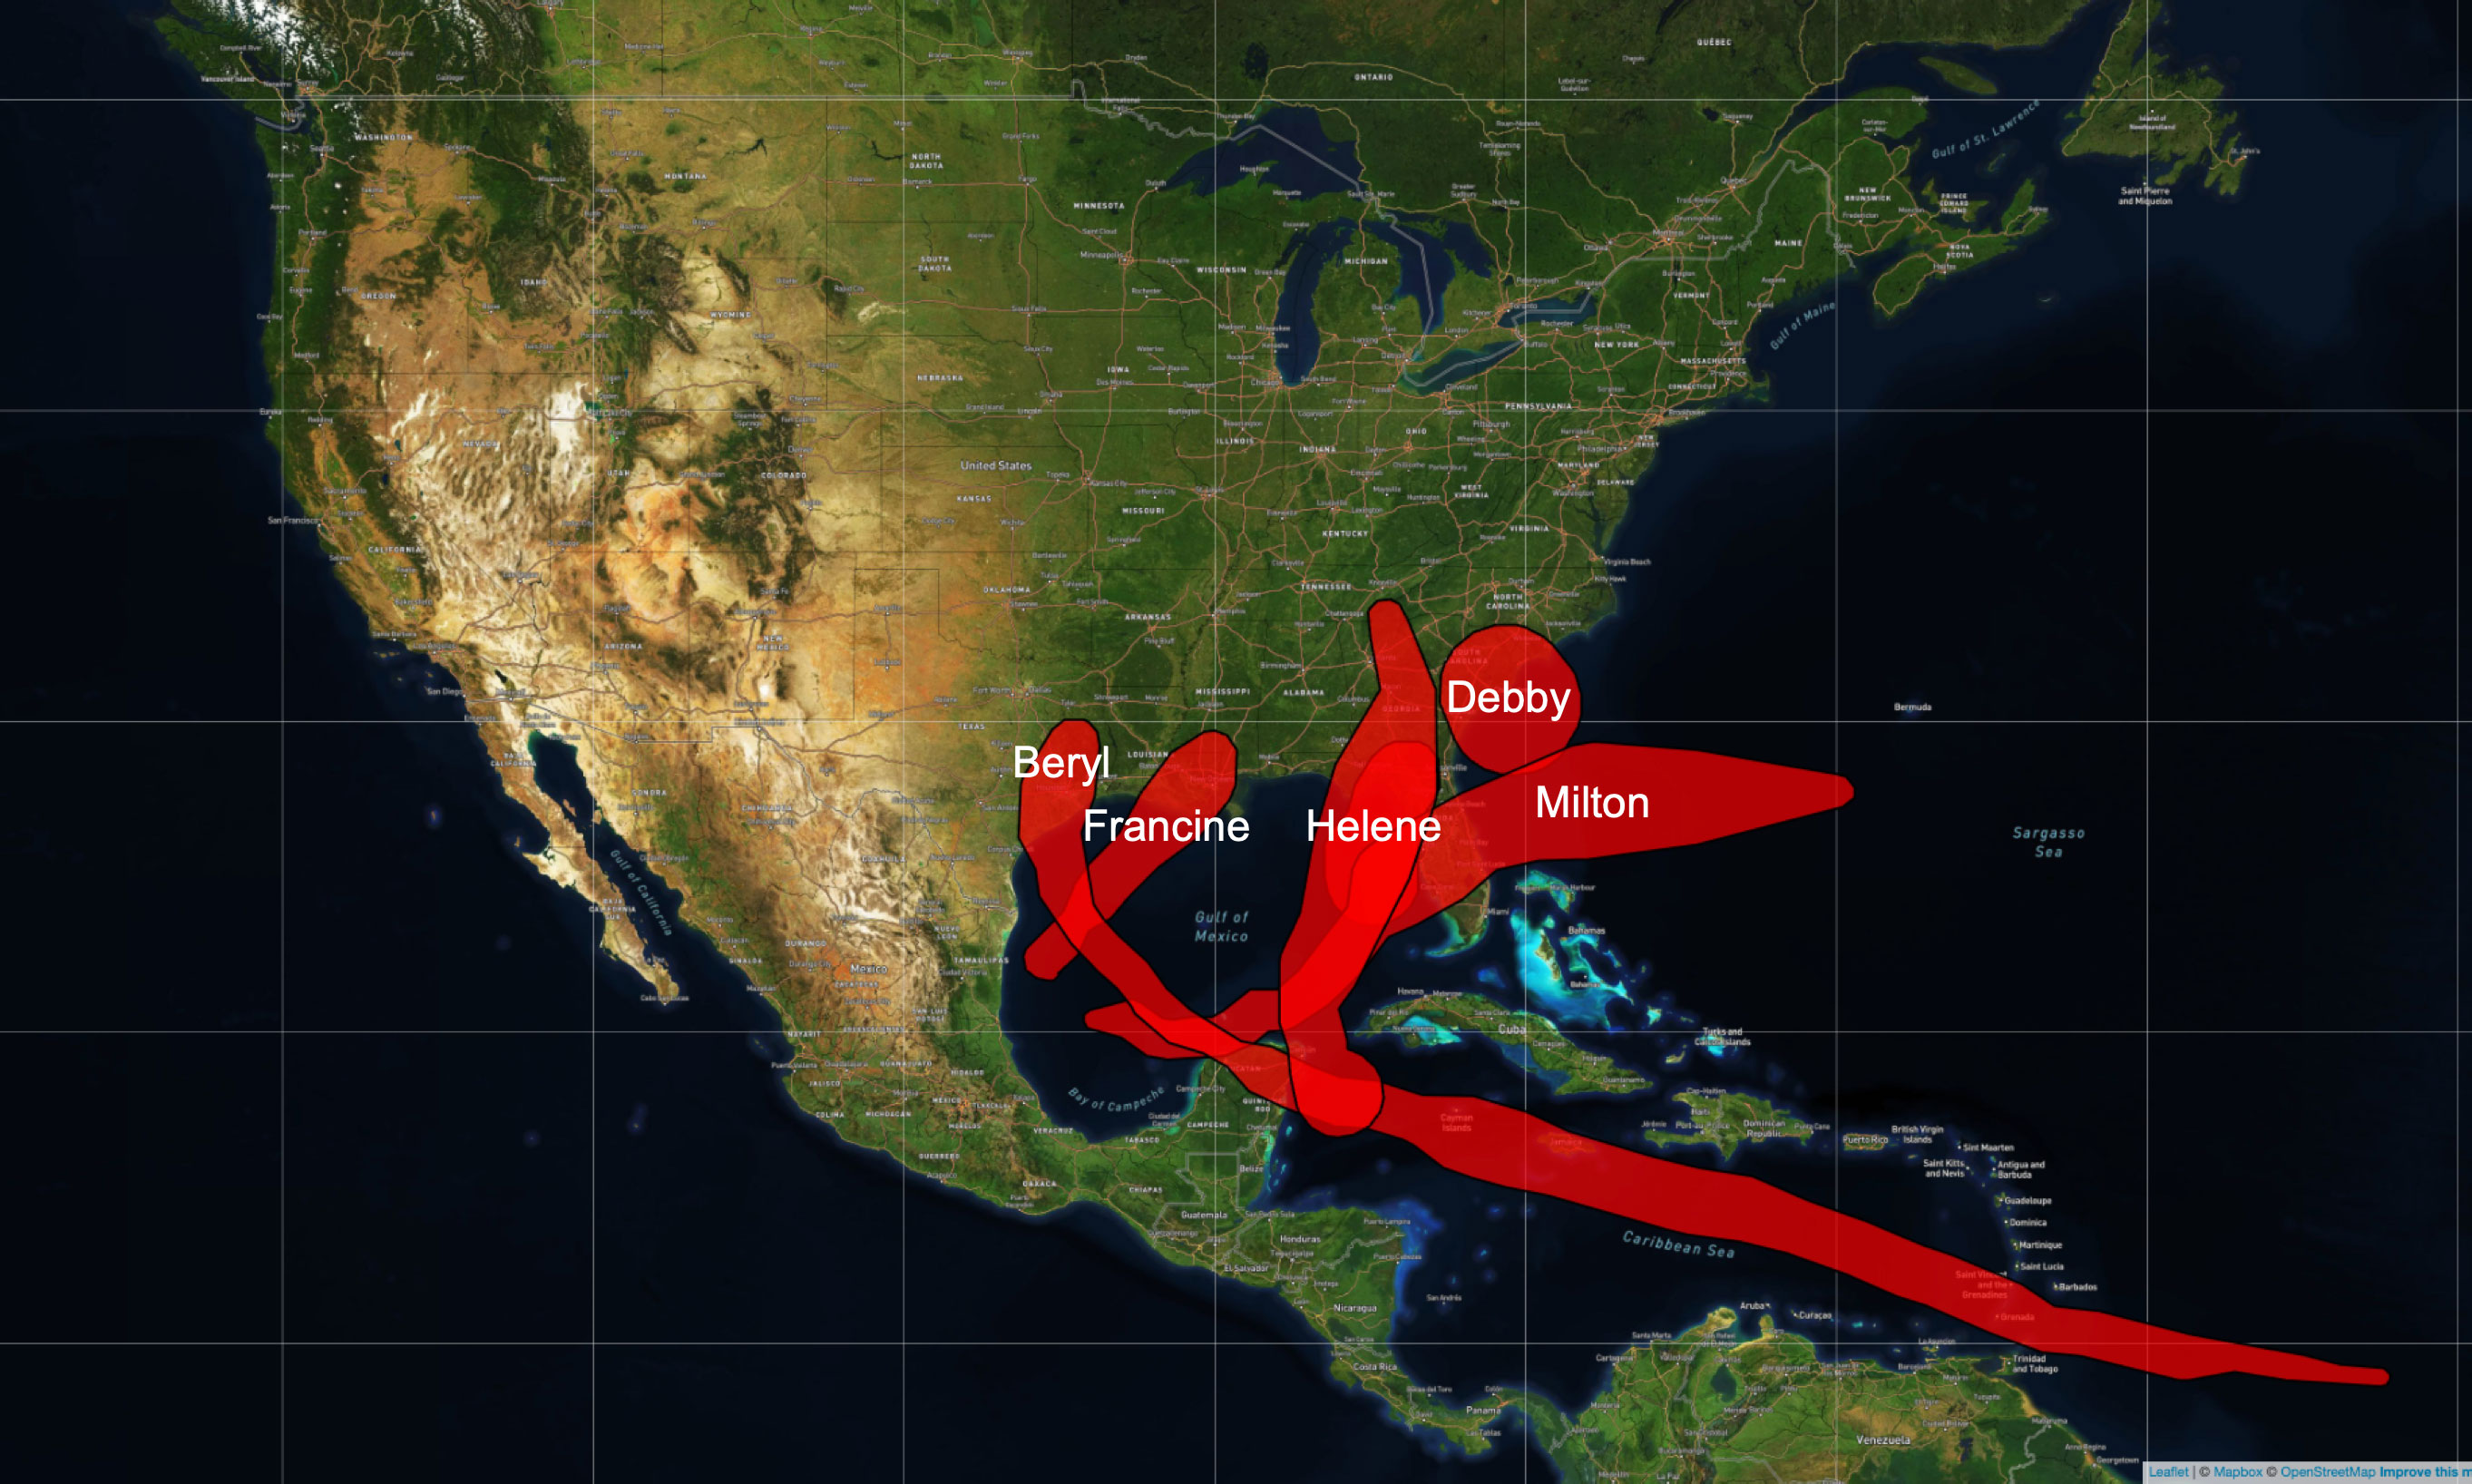
Figure 1. The paths of 50-knot winds during the five large U.S. hurricanes of the 2024. Source: ICE Climate as of 04/22/2025, and the Global Disaster Alert and Coordination System.
The follow-on impacts of these storms went far beyond direct damages to property and infrastructure. Few homes in areas affected by Hurricane Helene were in Federal Emergency Management Agency Special Flood Hazard Areas (FEMA SFHAs), where lenders typically require flood insurance.3 By one estimate, total residential repair costs in North Carolina due to Hurricane Helene could be over $12 billion.4 The impacts on homeowners and the local housing markets were substantial: working with ICE Climate, ICE Mortgage Technology’s Mortgage Monitor reported that delinquencies rose significantly in the aftermath of Hurricanes Helene and Milton in affected areas.
Local governments also confronted increased costs related to recovery. Municipal water utilities, in particular, faced an uphill battle to repair and rebuild in the aftermath of Hurricanes Helene and Milton. Significant damage to water treatment plants and water infrastructure in rural North Carolina meant that Asheville and surrounding towns were under a boil water notice for weeks after Hurricane Helene. According to one report, the town of Spruce Pine’s water system was “unsalvageable” after the storm.5 Hurricane Milton also damaged water systems across Florida, leading to many millions of gallons of wastewater spilling into natural water systems.6,7
The storms also had major impacts on manufacturing and food production in the region. Together, Hurricanes Helene and Milton caused billions of dollars in losses for the poultry industry in Georgia and Florida.8 Milton alone caused billions in damage for the Florida citrus industry.9 Effects were felt farther afield as well: one facility in North Cove, North Carolina, that typically supplies 60% of the country’s IV fluid, was flooded during Hurricane Helene and forced to stop production, causing a national shortage10 (similar shortages took place in 2017 after Hurricane Maria impacted manufacturing sites). Several quartz mines in Spruce Pine, North Carolina, were also forced to close, creating global concern about the supply of quartz for the semiconductor industry.11
These examples highlight the need to understand financial exposure to active weather events. By integrating forecasted storm paths from the Global Disaster Alert and Coordination System with National Weather Service flood and tornado alerts, ICE can now identify this exposure across asset classes as events unfold. Below, we demonstrate this capability using the 2024 hurricane season as a case study — looking at the exposure of corporations and corporate debt securities, municipalities and municipal bonds, and properties in commercial mortgage-backed security pools to these storms.
The five large U.S. hurricanes of 2024 are used here as examples, but the power of this approach is that it allows ICE Climate to map this exposure prospectively, based on this upcoming hurricane season’s forecasted storm paths.
Corporate exposure
ICE Climate identified over 350,000 corporate asset locations in the paths of storm-force winds12 during Hurricanes Beryl, Debby, Francine, Helene and Milton. During Hurricanes Milton and Beryl — which impacted densely populated areas in Florida and Texas, respectively, — over 100,000 corporate locations were exposed to these high windspeeds.
Hurricanes often have disproportionately large impacts on specific sectors. The restaurant industry is one example.13 With a large-scale database of corporate assets and their locations, ICE Climate can identify almost 18,000 restaurants and bars14 in the paths of these storms — over 5,900 during Hurricane Milton alone. The most exposed restaurant companies (in terms of number of locations) include widely recognized fast-food, pizza, and steakhouse chains (Figure 2).
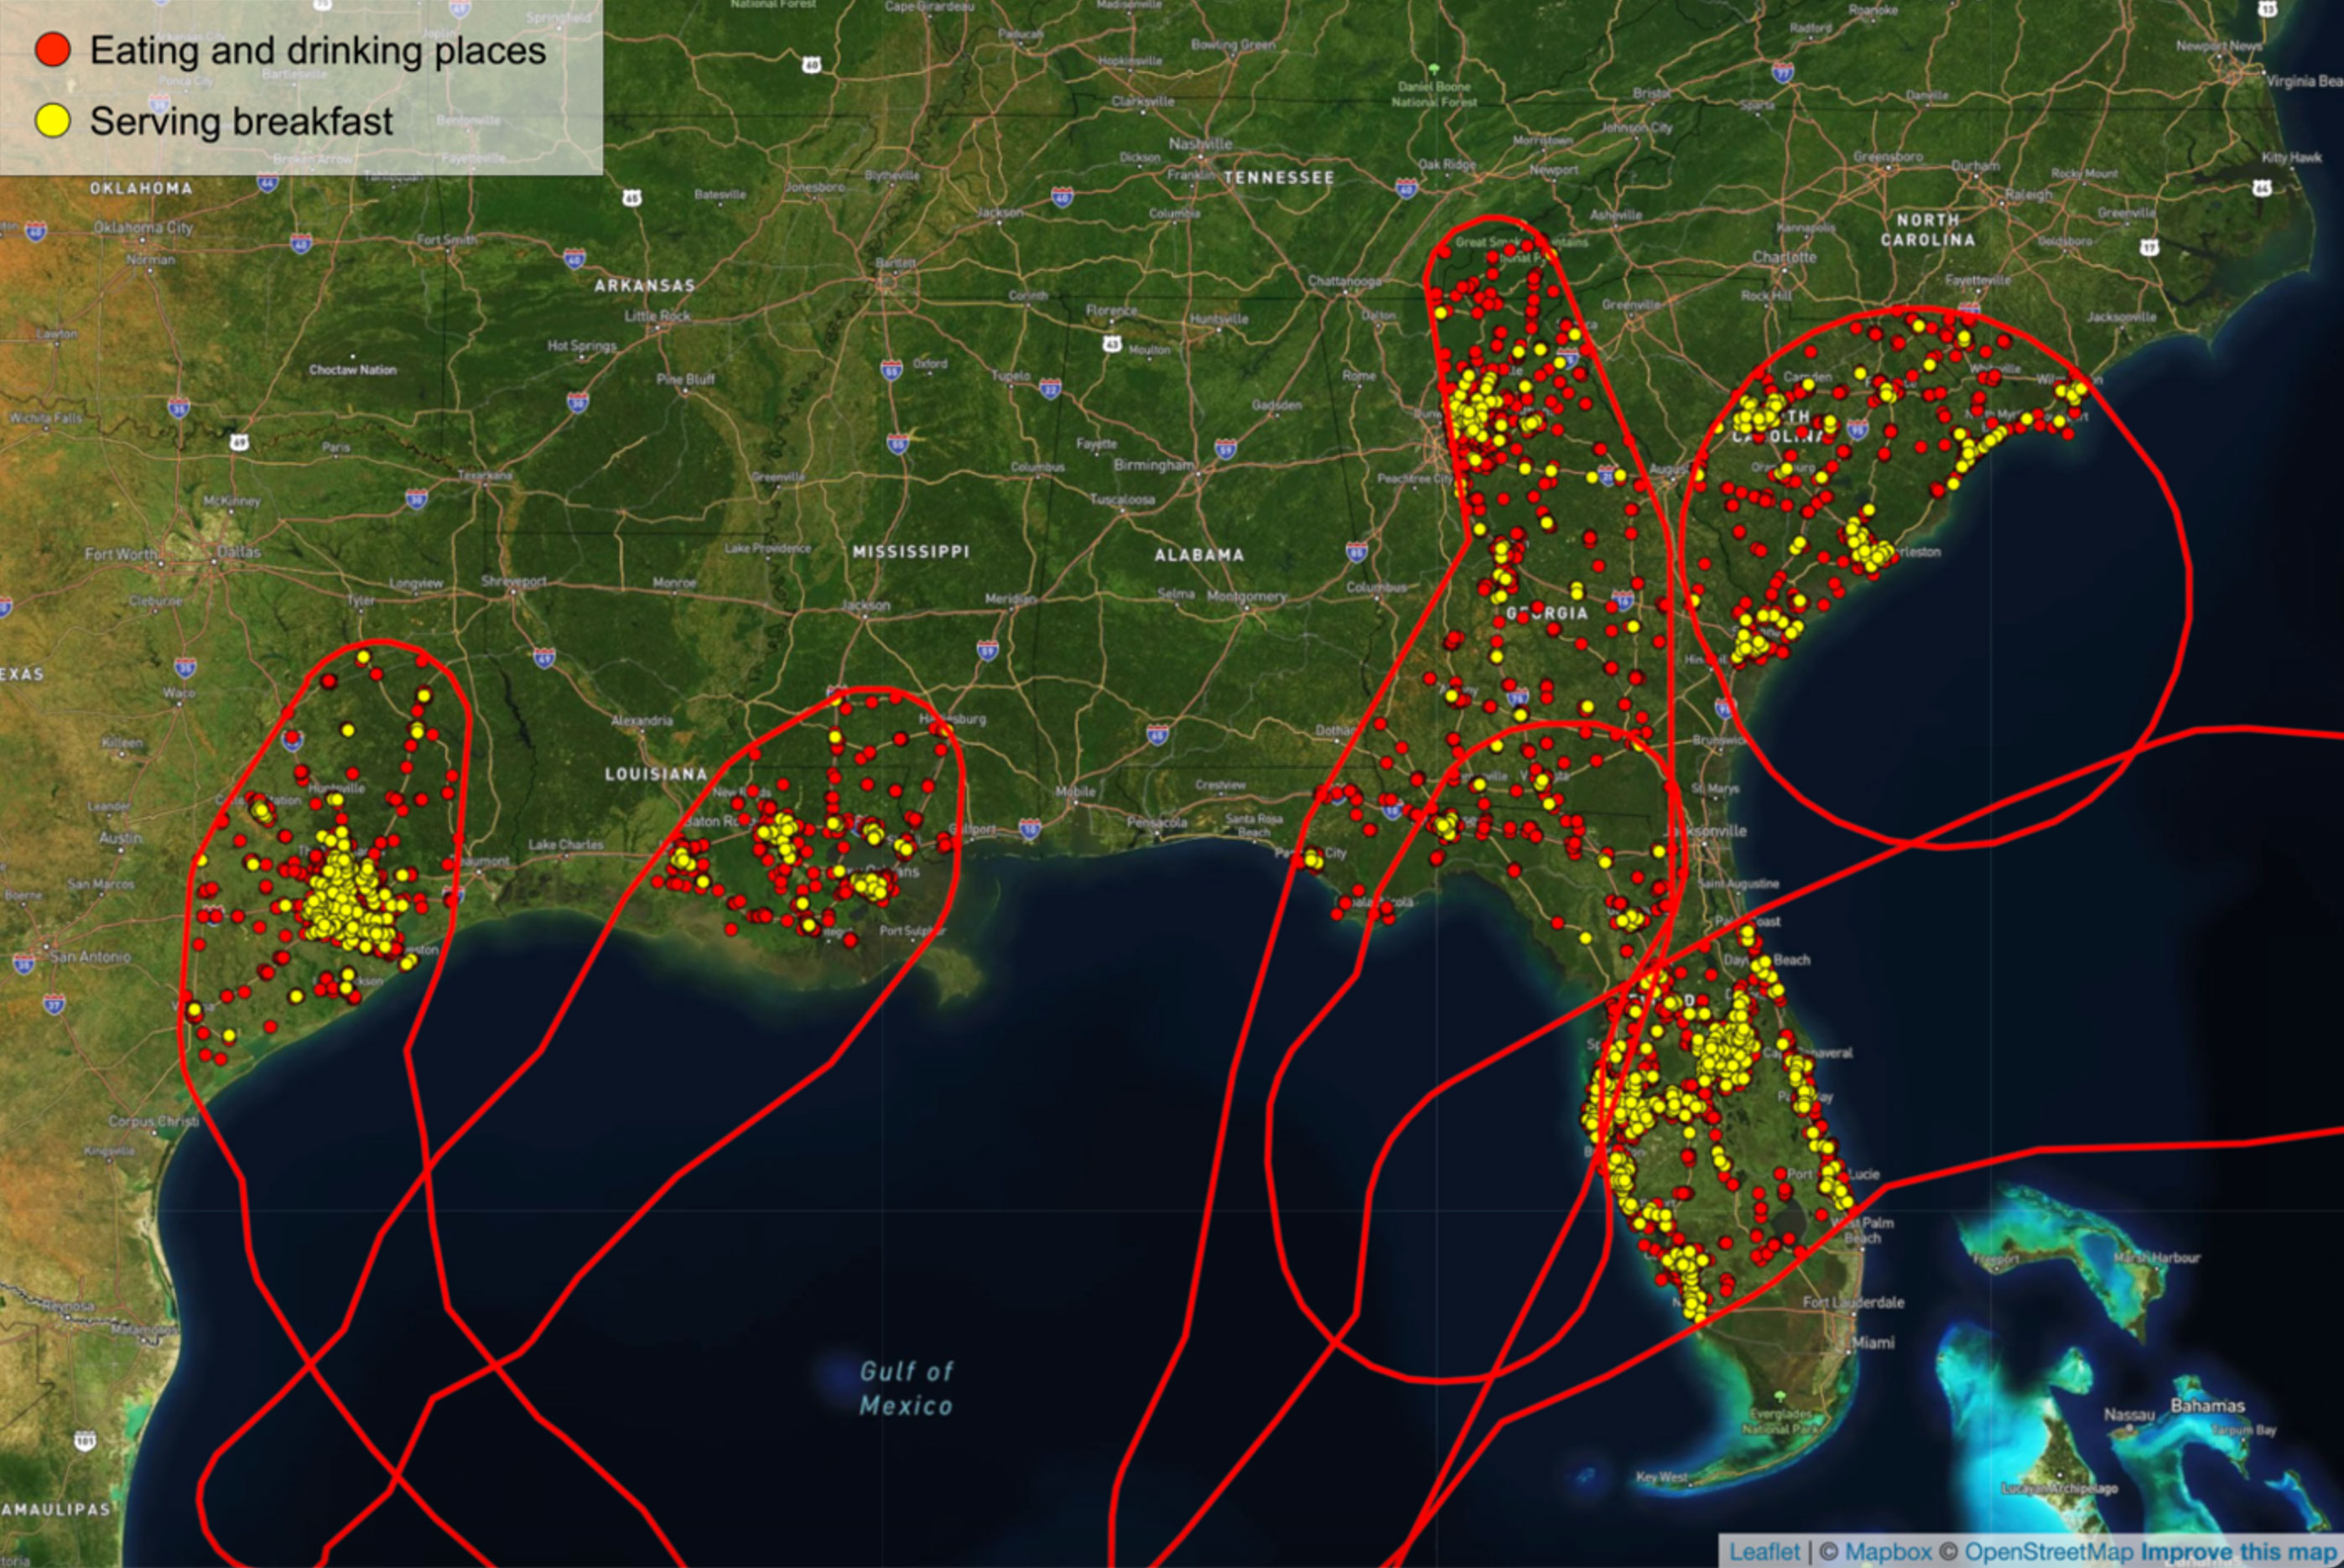
Figure 2. Eating and drinking places exposed to forecasted storm-force (50-knot or higher) winds during the five U.S. hurricanes of 2024. Red dots are all eating and drinking places in ICE Climate’s database of corporate asset locations; yellow dots show the subset associated with three chains with among the most locations exposed in the database that are known for serving breakfast. Source: ICE Climate as of 04/25/2025.
By linking corporate asset locations to their parent companies, ICE can identify corporate debt issuers exposed to these storms — as well as the sectors of these issuers and the associated securities. In total, ICE Climate can identify almost 14,000 distinct corporate debt-issuing entities with at least one location that was exposed to these storms. As of late April 2025, these issuers are associated with over 500,000 corporate debt securities.
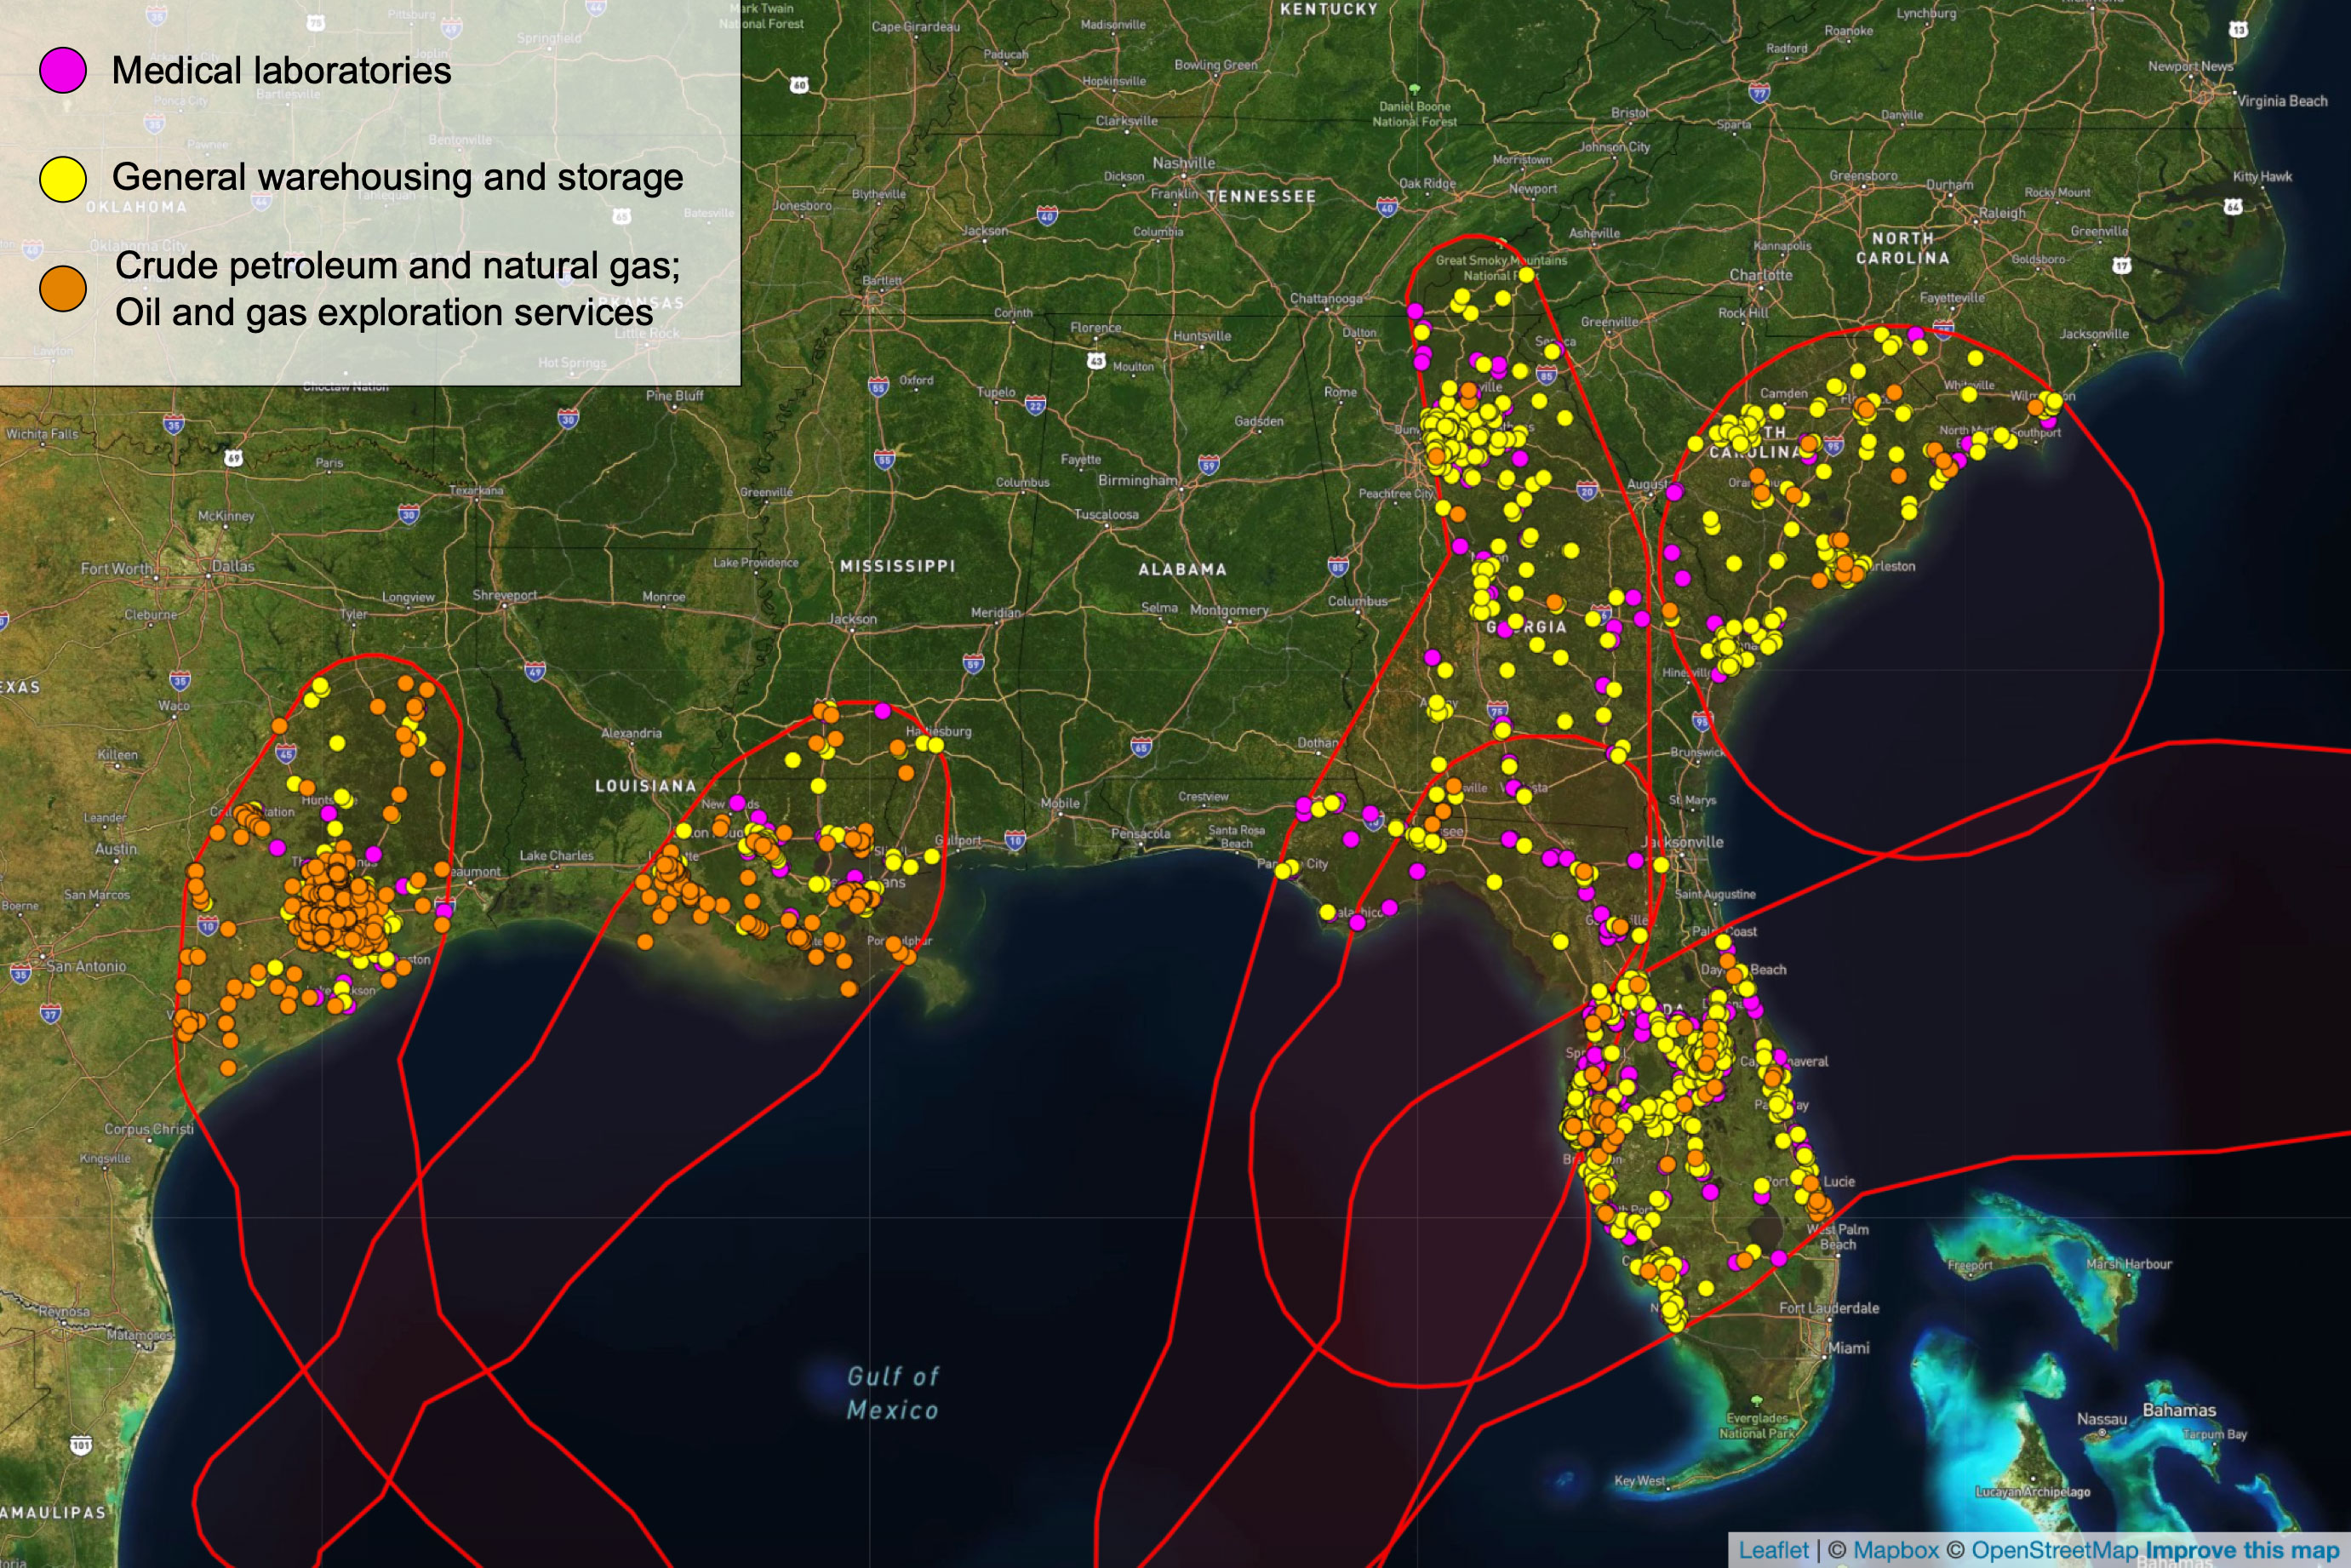
Figure 3. Medical laboratories, general warehouses, and crude petroleum and oil and gas-related asset locations exposed to 50-knot winds or higher during the 2024 hurricane season. Source: ICE Climate as of 04/25/2025.
| No. exposed issuers | No. associated assets | No. exposed securities¹⁵ | |
|---|---|---|---|
| Beryl | ~9,490 | ~36,860 | ~236,190 |
| Francine | ~4,330 | ~12,200 | ~80,700 |
| Debby | ~5,660 | ~21,700 | ~84,500 |
| Helene | ~6,660 | ~26,260 | ~90,500 |
| Milton | ~7,460 | ~38,820 | ~119,490 |
Table 1. Exposure statistics for corporate debt issuers with locations in the paths of the five large U.S. hurricanes in 2024. Source: ICE Climate as of 04/23/2025.
Municipal bond exposure
ICE Climate has previously published analyses of municipal bond exposure to Hurricanes Helene and Milton. Here we extend this analysis to the five hurricanes of the 2024 hurricane season. In total, across the five hurricanes, about 2,800 local municipal issuers were exposed to tropical storm-force winds (50 knots or higher). As of April 2025, these issuers have about $324 billion in outstanding municipal debt (over 98,500 individual securities). Many of these municipal entities were exposed to multiple storms (this is the reason that the sum of the third column in the table below is greater than $324 billion).
| No. exposed issuers | No. associated assets | Total municipal debt outstanding ($) | |
|---|---|---|---|
| Beryl | ~1,240 | ~69,090 | ~145 billion |
| Helene | ~550 | ~10,740 | ~80 billion |
| Milton | ~840 | ~11,630 | ~76 billion |
| Debby | ~450 | ~11,350 | ~76 billion |
| Francine | ~200 | ~4,250 | ~17 billion |
Table 2. Summary of local municipal bond (municipal entitles <~5,000 sq kms) exposure to the five large U.S. hurricanes in 2024. Security numbers and total outstanding debt associated with these issuers are as of late April 2025. Source: ICE Climate as of 4/22/2025.
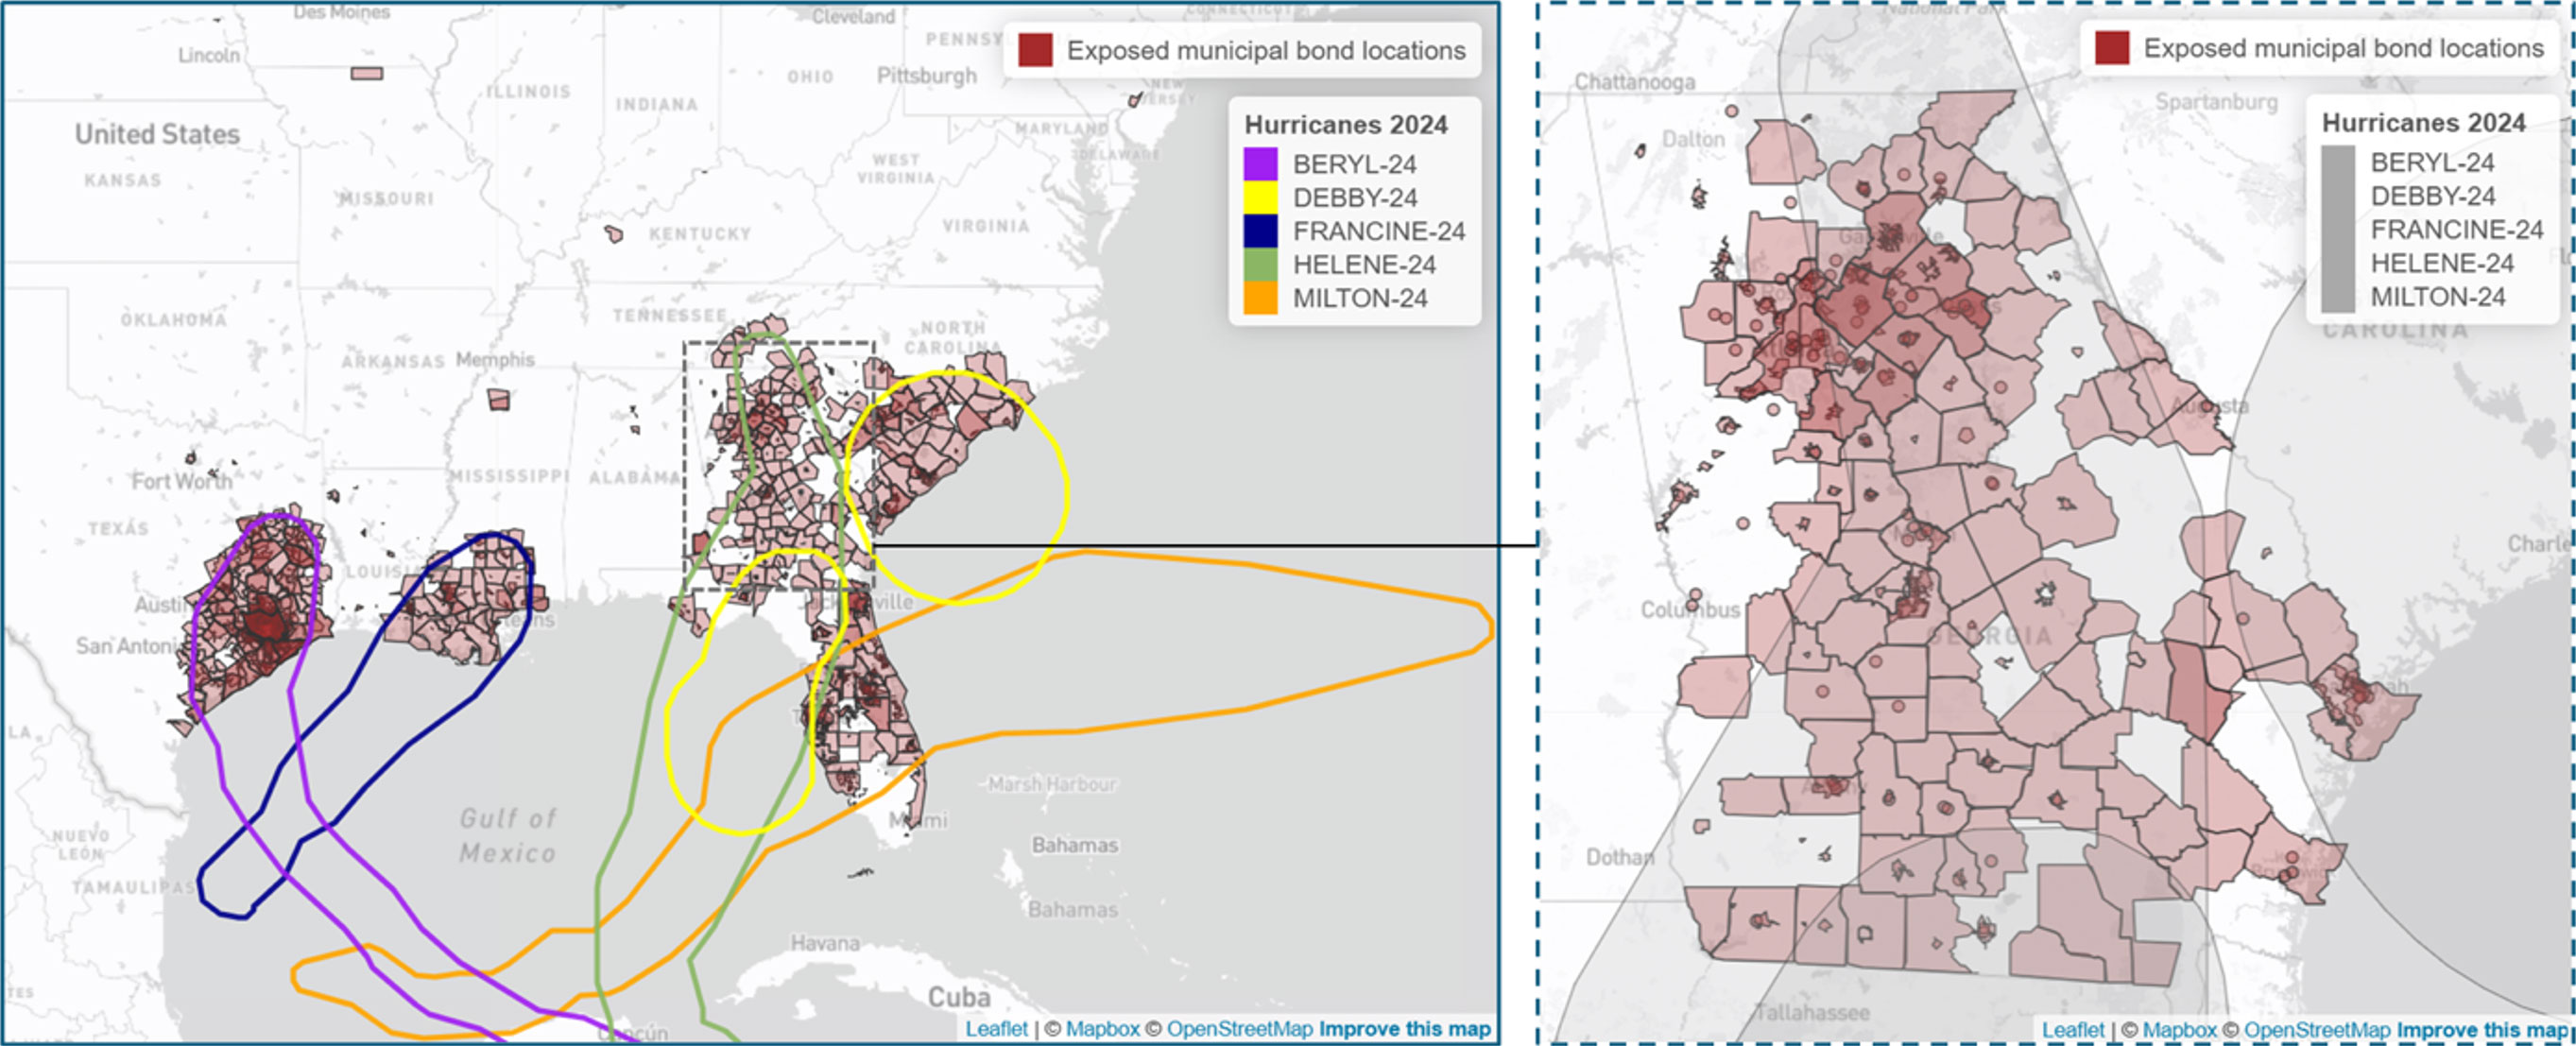
Figure 4. Map of all local (<~5,000 sq km) municipal locations exposed to the five 2024 hurricane paths in the southeast region of the United States and a zoomed-in map of that exposure in state of Georgia. Source: ICE Climate as of 4/22/25. Forecasted hurricane paths sourced from the Global Disaster Alert and Coordination System.
Debt issued by school districts for primary/secondary education purposes make up the largest share of exposed local debt. Notably, there was more than $30 billion in outstanding water and sewer debt associated with local municipal entities exposed to these storms (Figure 5) as of late April 2025. Water and sewer is an infrastructure sector that is often hard-hit during hurricanes and flood events.16
Types of municipal projects (use of proceeds) most exposed to major 2024 hurricanes
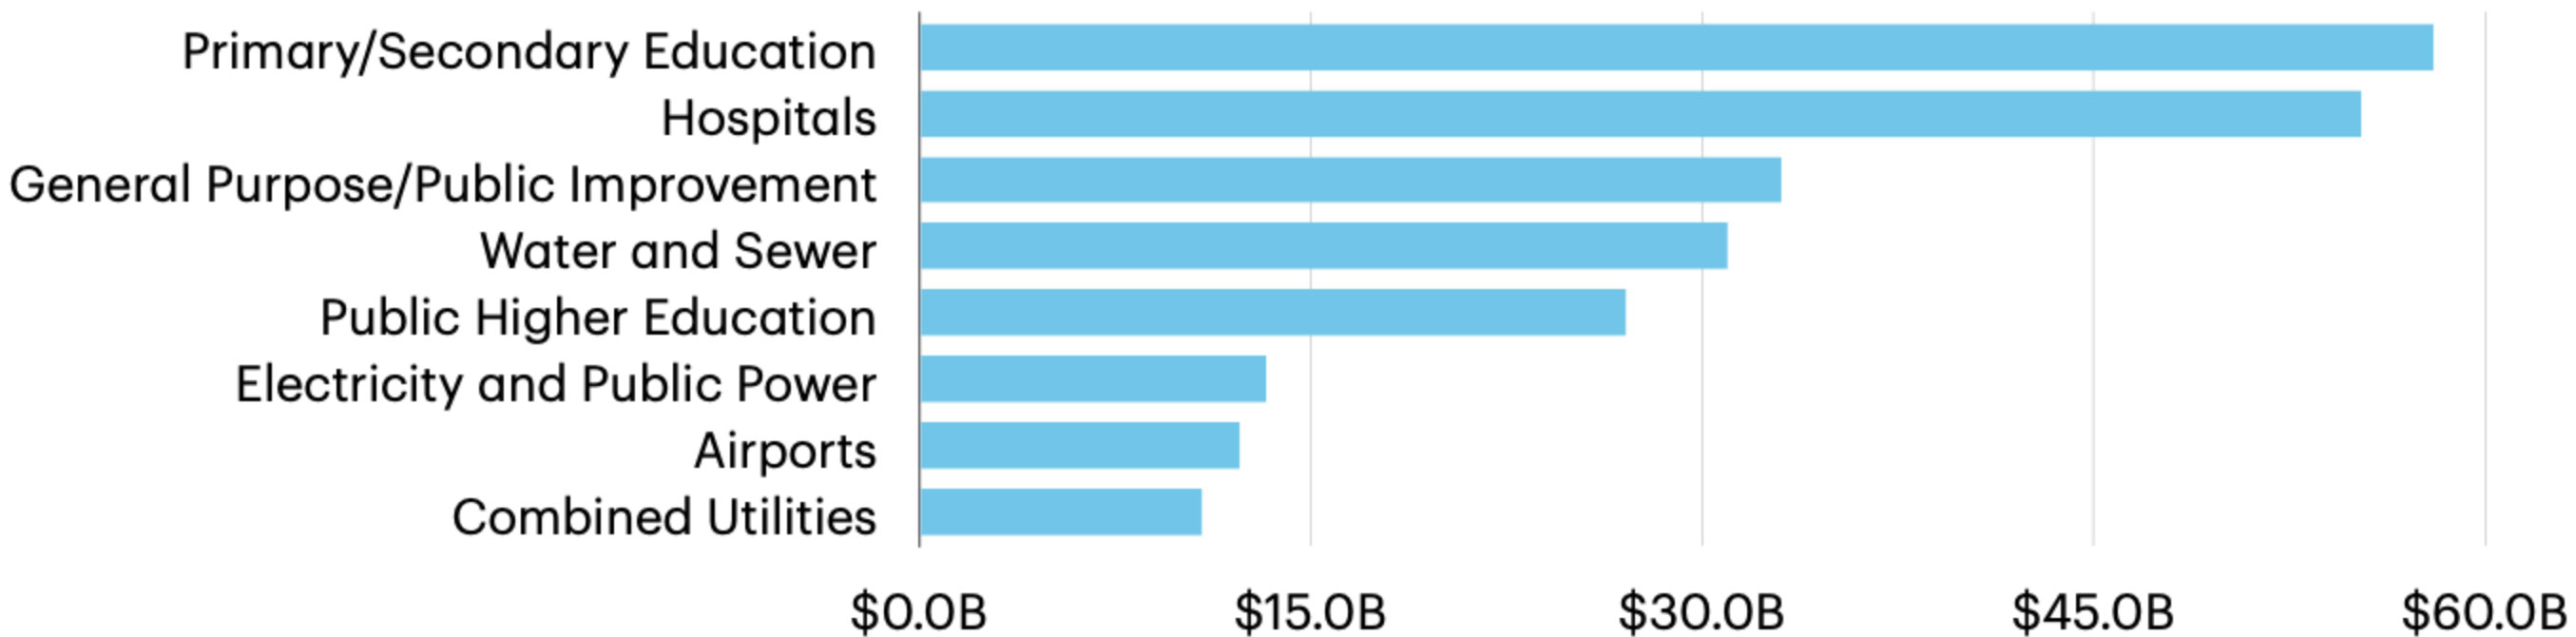
Figure 5. Total exposed debt by use of proceeds associated with local municipal entities (only use of proceeds categories with more than $10 billion exposed are shown). Source: ICE Climate as of 4/22/25.
Finally, windspeeds are not the only hurricane-related hazard that can impact communities during hurricanes. Intense rainfall during Hurricane Helene destroyed infrastructure and homes in communities across western North Carolina, and tornado swarms impacted a large swath of the Midwest during Hurricane Beryl (Tornados also impacted Florida during Hurricane Milton). ICE can map exposure to these kinds of hurricane-related hazards based on the National Weather Service’s observed alerts for floods and tornados.
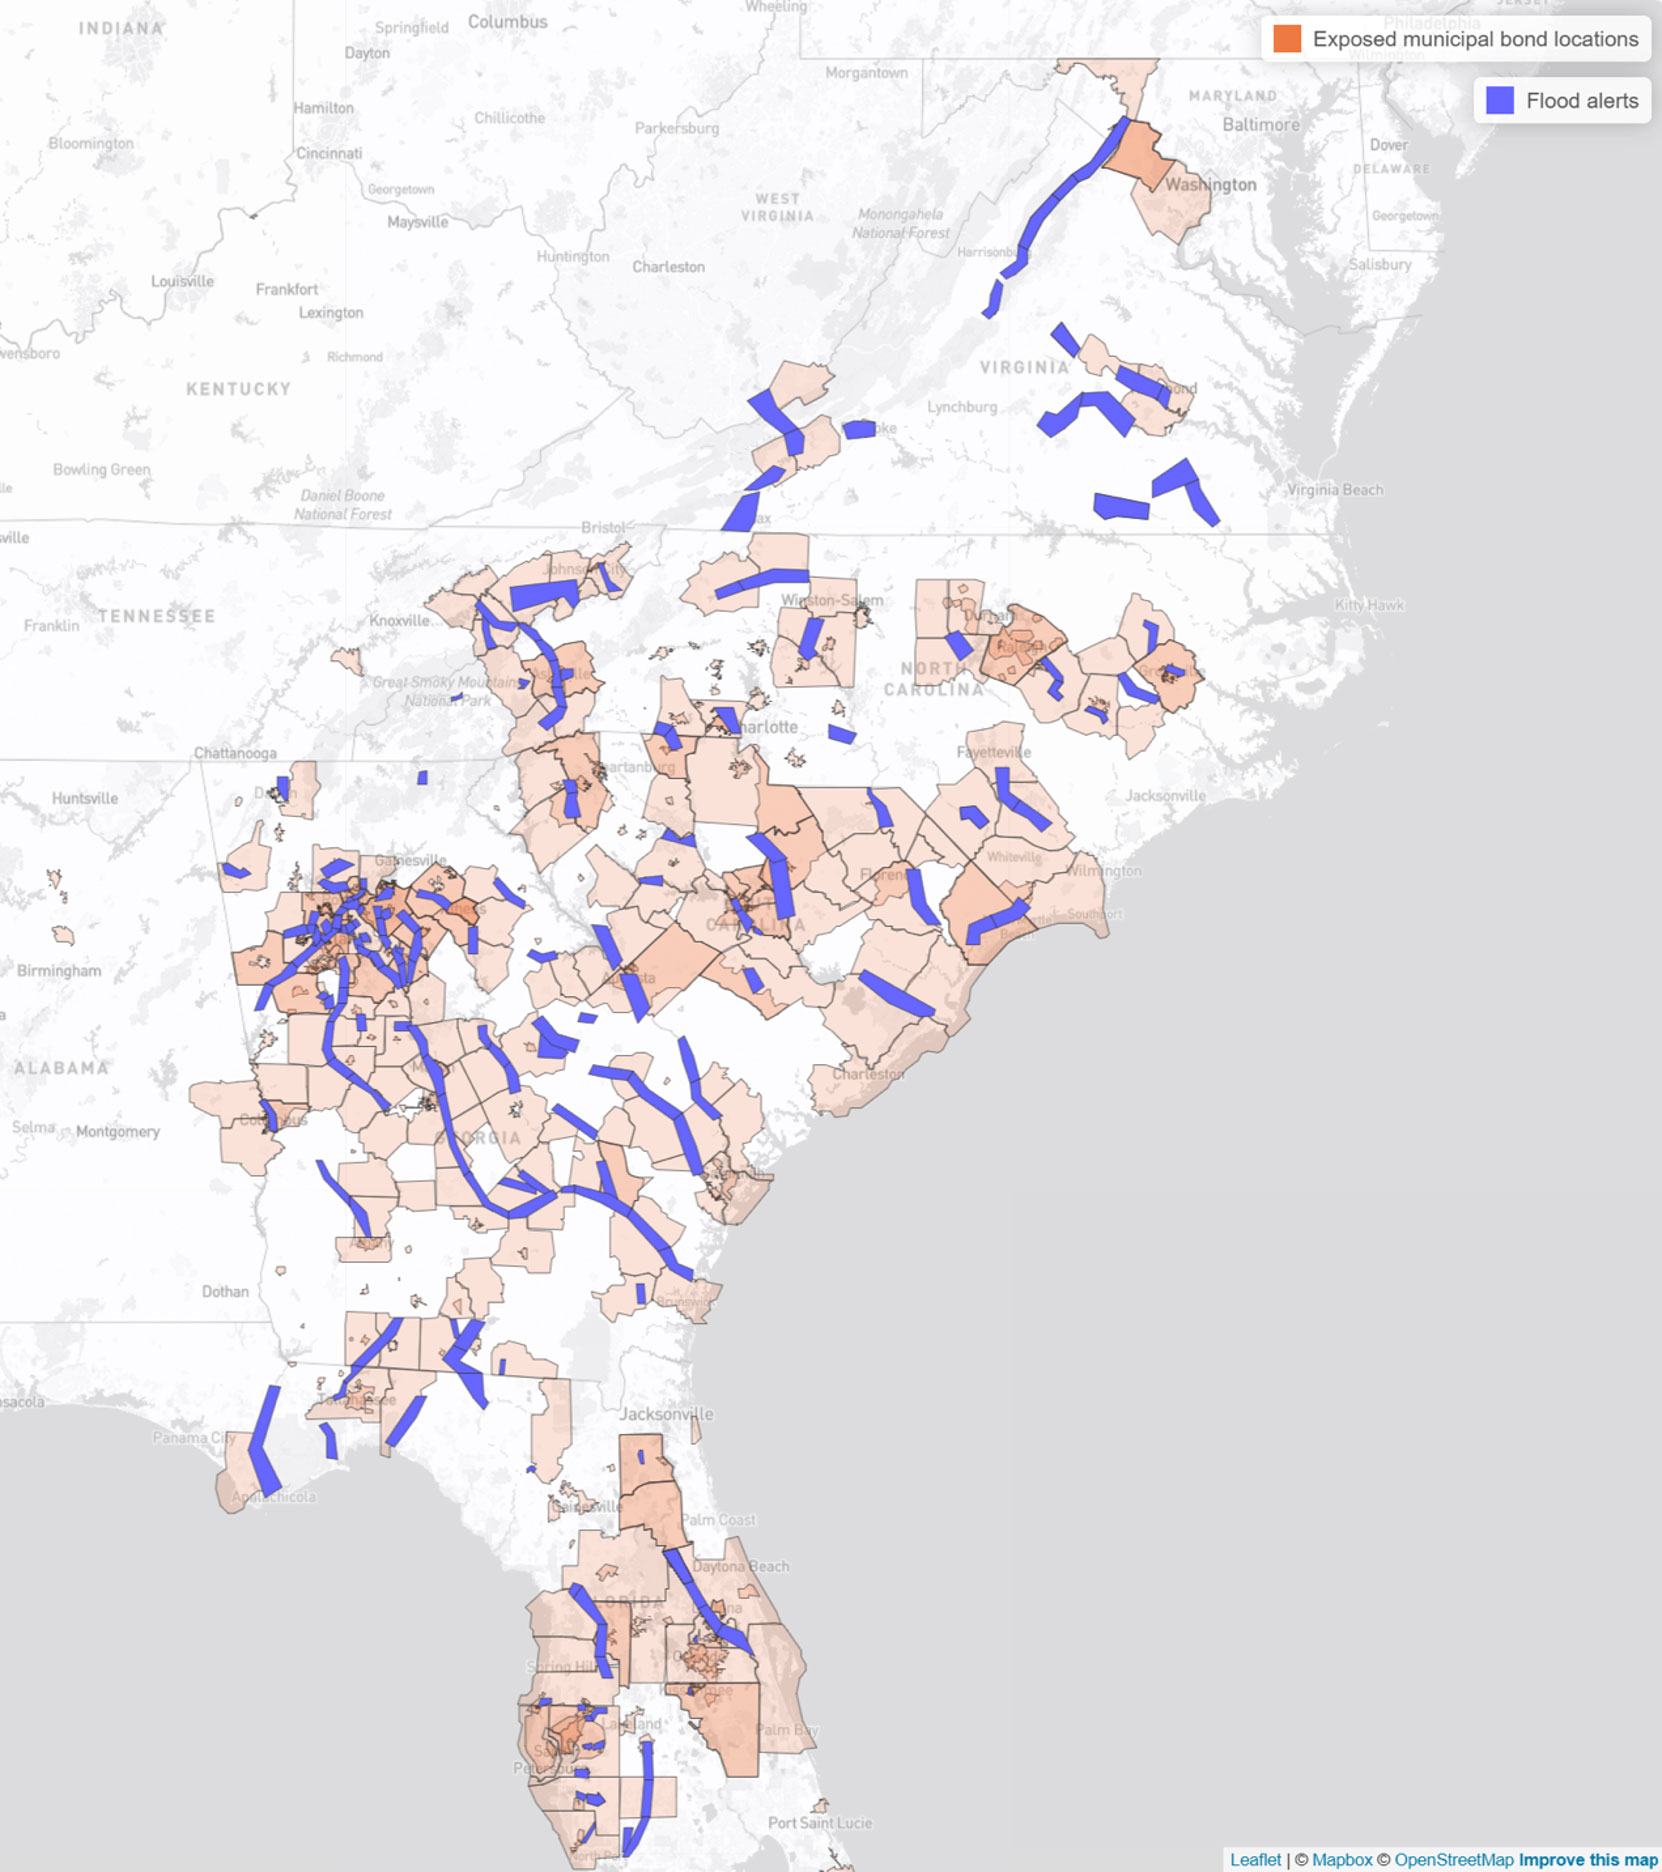
Figure 6. Map of flood events and overlapping municipal bond locations during the period that Hurricanes Helene and Milton impacted the U.S. east coast (September 22-October 20, 2024). During this period, over 1,550 local municipal locations were exposed to observed flood events in the eastern U.S., linked to over 35,200 securities as of April 2025 — a total of more than $298 billion in outstanding municipal debt. Source: ICE Climate as of 04/25/2025.
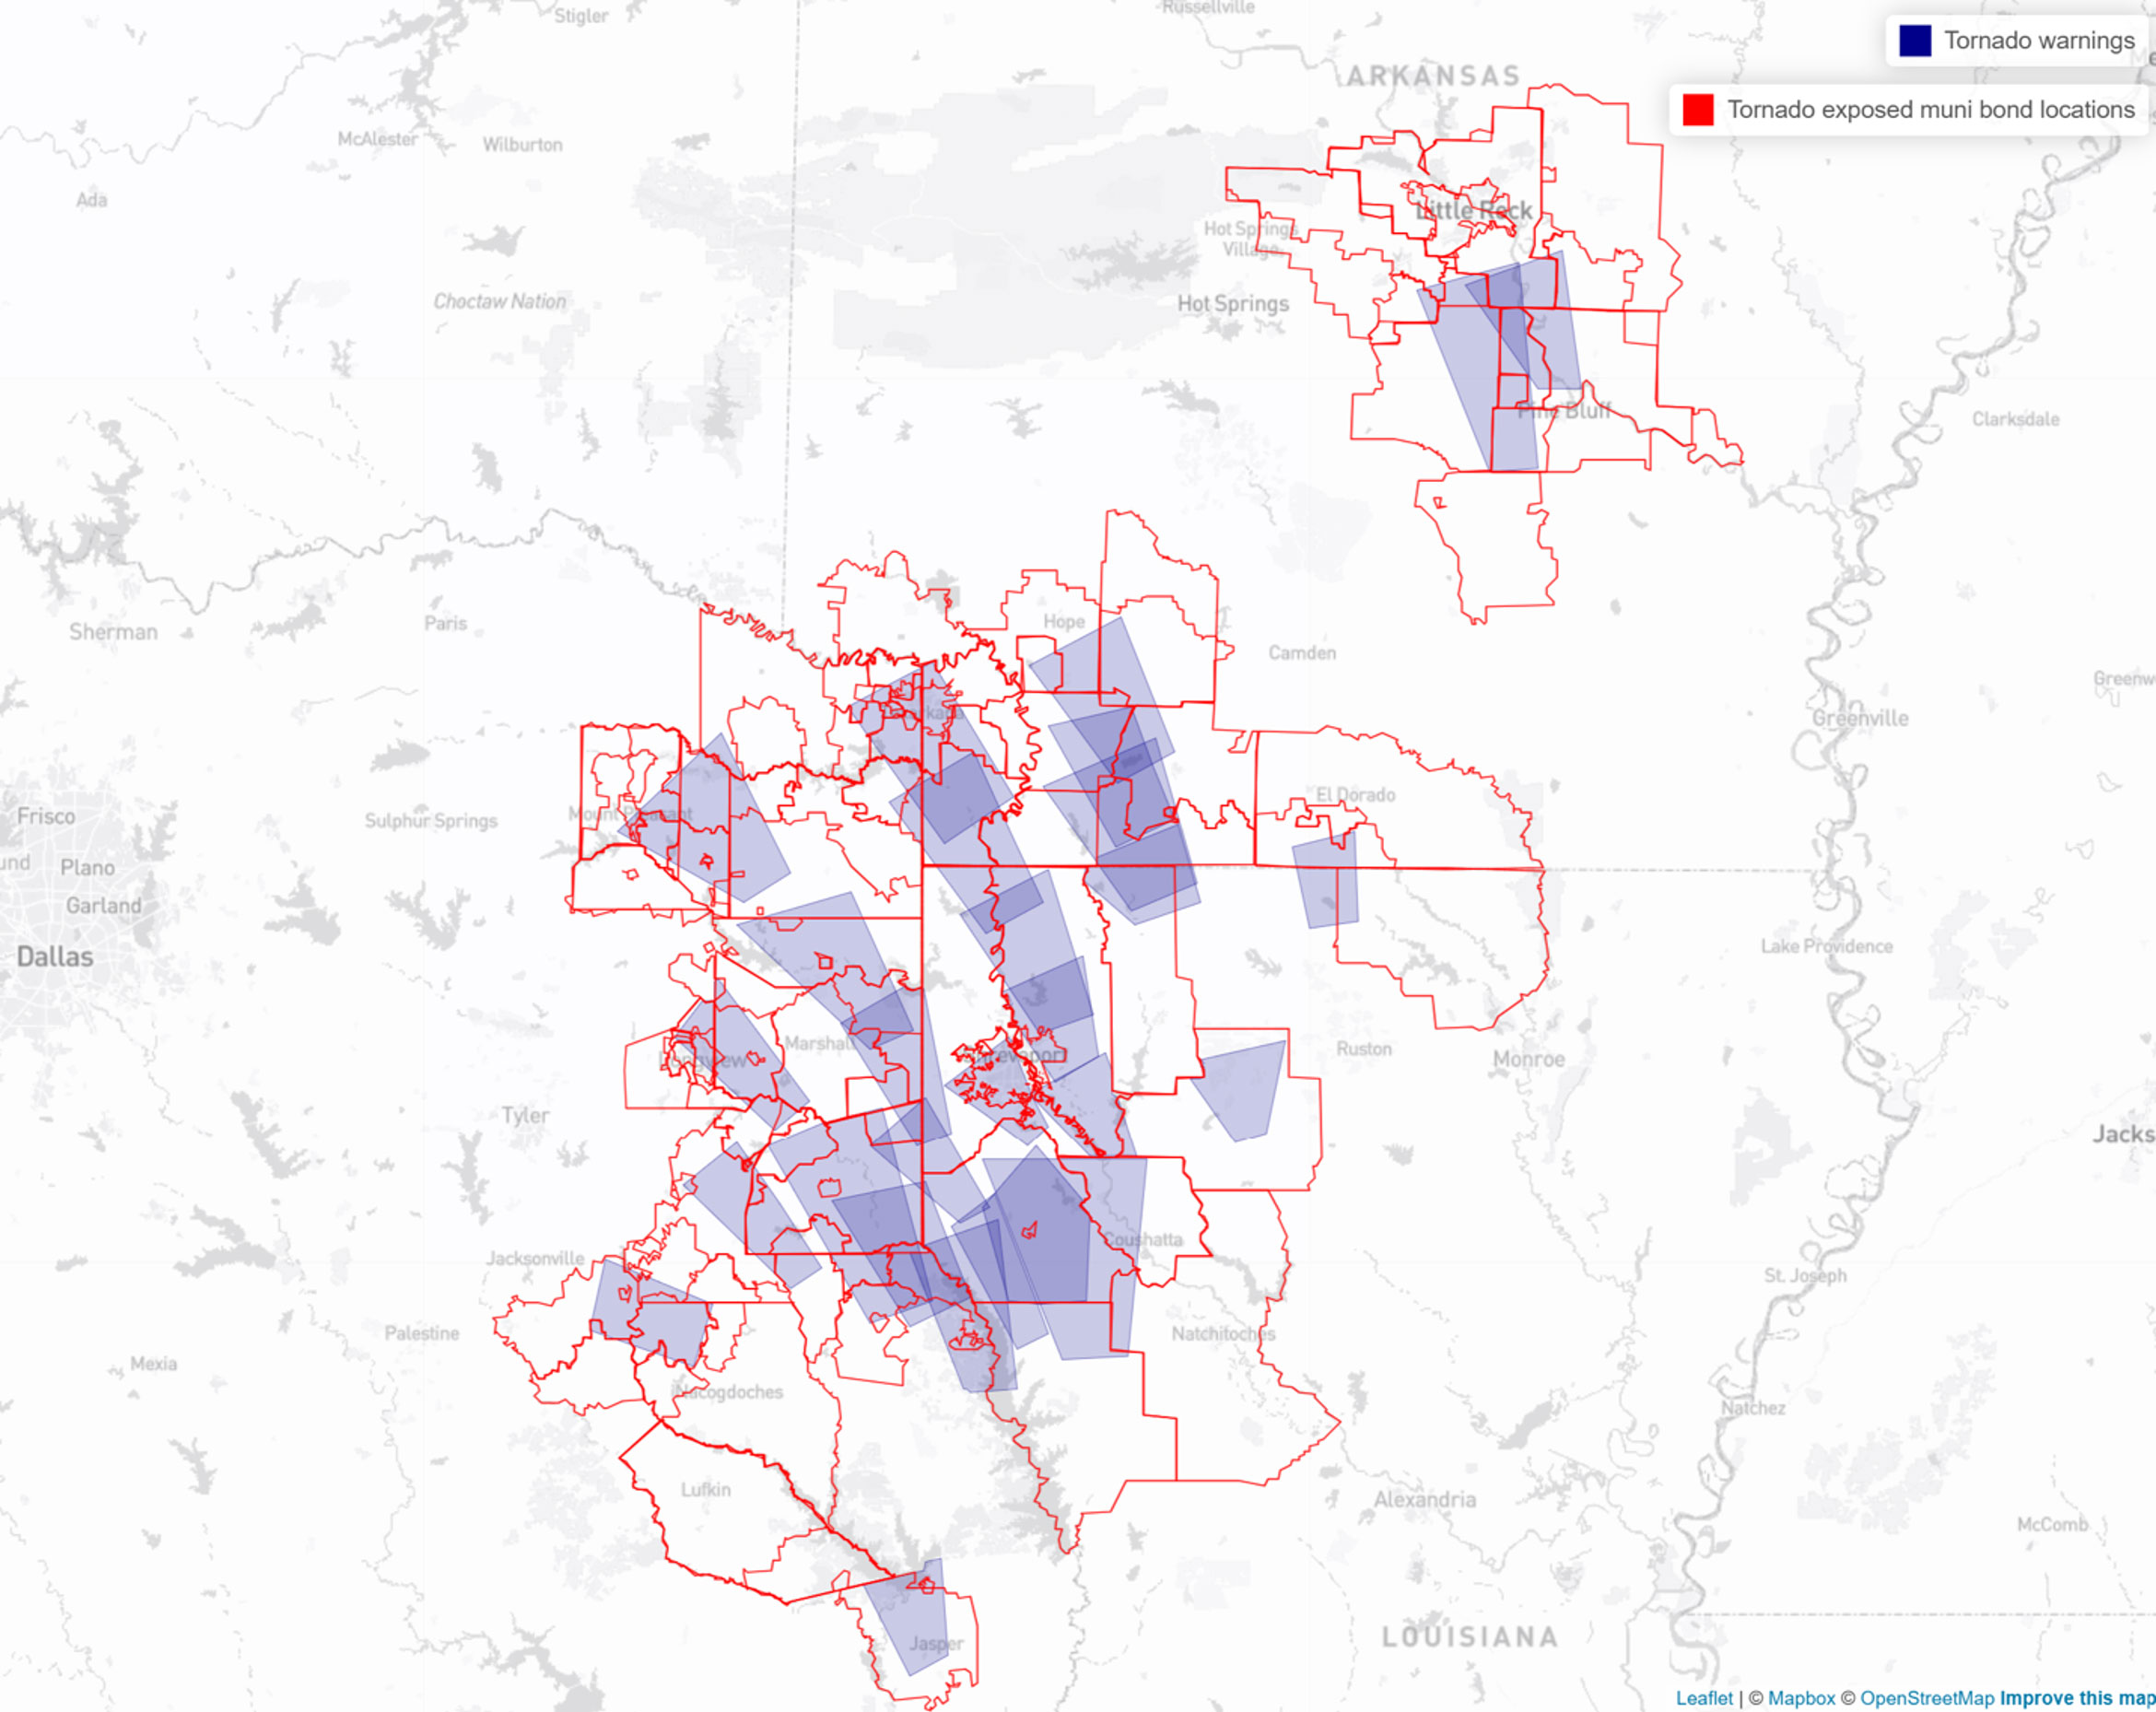
Figure 7. Between July 5 and 12, 2024, the remnants of Hurricane Beryl caused a series of tornado outbreaks across a large swathe of the southern, midwestern and northeastern United States. Municipal bond exposure to one swarm that tracked across Louisiana, Texas, and Arkansas is shown above. In total, ICE identifies over 400 local municipal locations exposed to National Weather Service observed tornado alerts as Hurricane Beryl moved across the country. Source: ICE Climate as of 04/25/2025.
Property exposure
Over 17 million properties in ICE Property Assessment Tables were exposed to forecasted high windspeeds (50 knots or higher) during the five large U.S. hurricanes of 2024. The immediate implications for many exposed households in terms of delinquency, foreclosure, and prepayment rates were examined in ICE’s November and December 2024 Mortgage Monitor reports.
Number of properties exposed to high wind speeds during major 2024 hurricanes
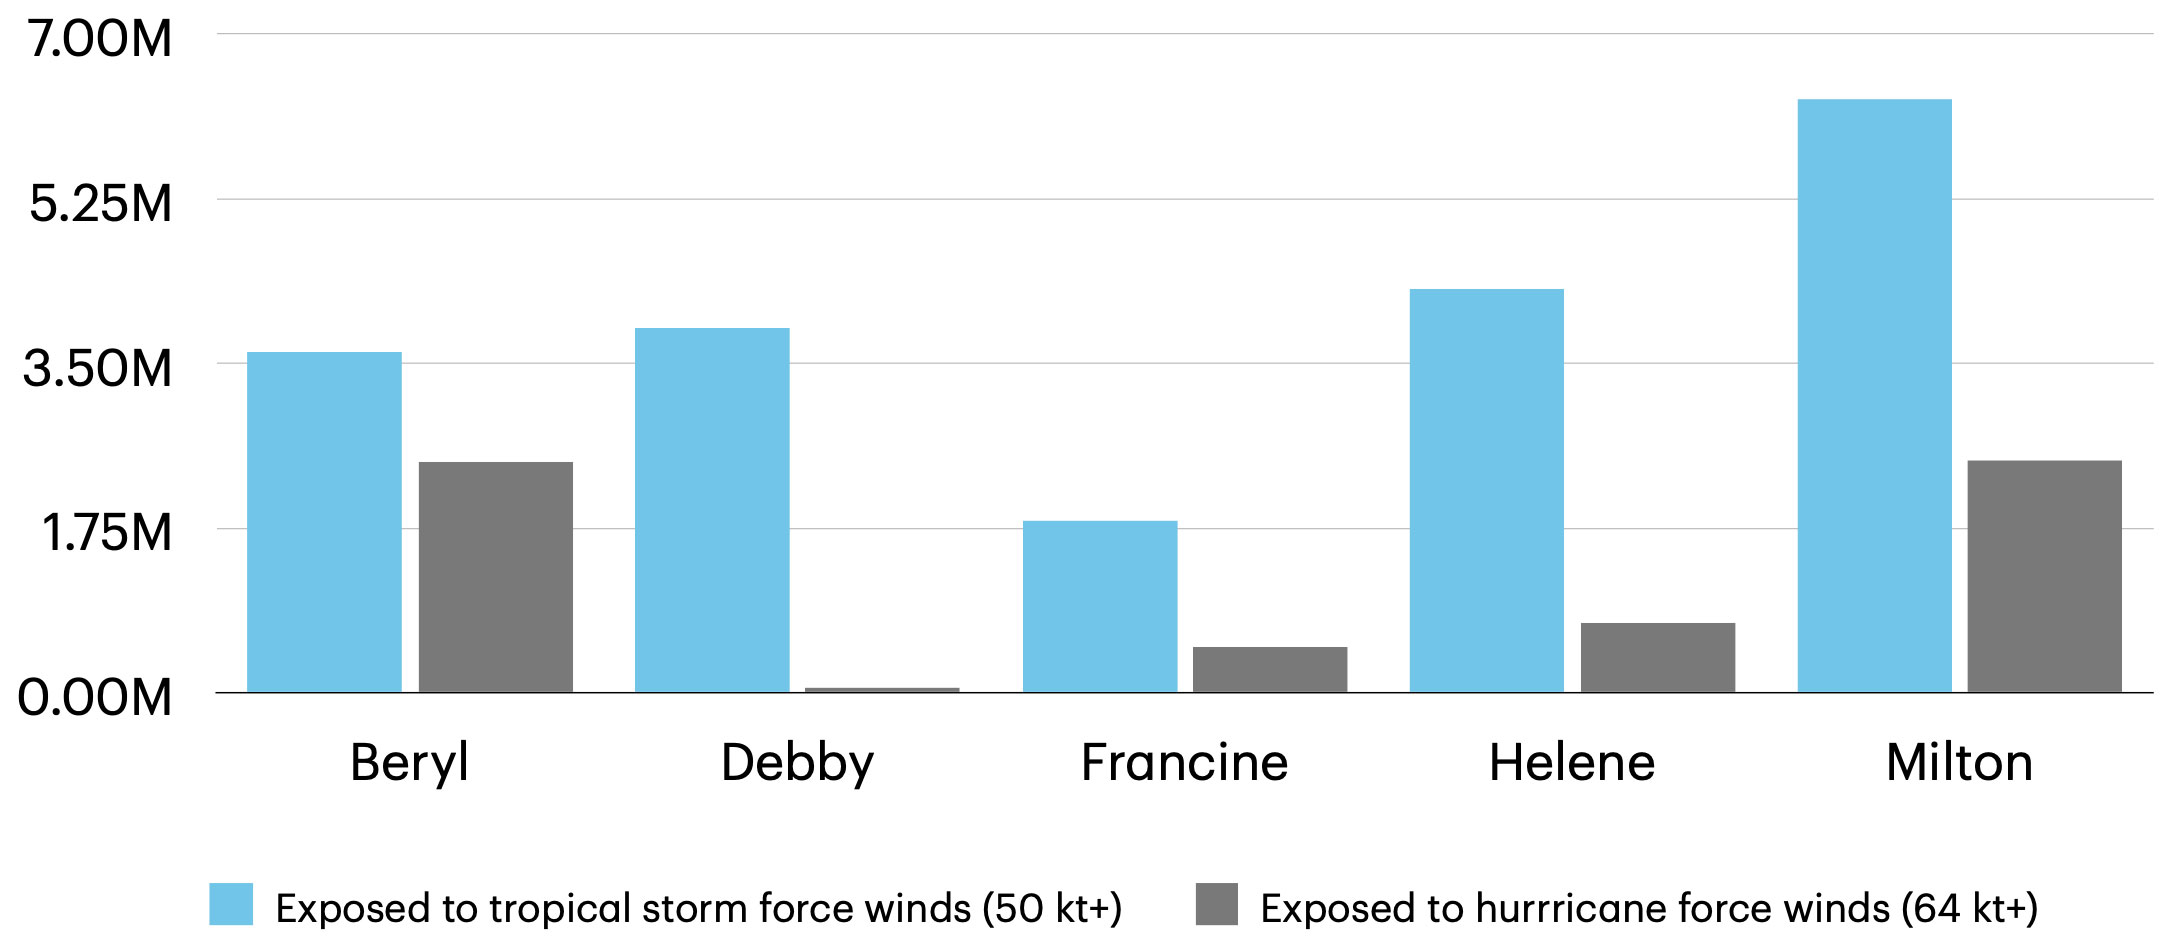
Figure 8. Numbers of properties exposed to large U.S. hurricanes of 2024 as identified by ICE Climate. Source: ICE Climate and ICE Property Assessment Tables as of 04/25/2025.
Importantly, ICE Climate can map not only where these properties are located, but, in the case of flood events, where these properties are in relation to Special Hazard Flood Areas (SHFAs).
Below is a map of part of Asheville, North Carolina, showing a region affected by flooding caused by Hurricane Helene. Only a small percentage of properties in this area in red were in FEMA-designated SFHAs, where flood insurance is mandated for homeowners with mortgages. Across larger Buncombe County, where Asheville is located, about 99% of structures did not have flood insurance.17, 18
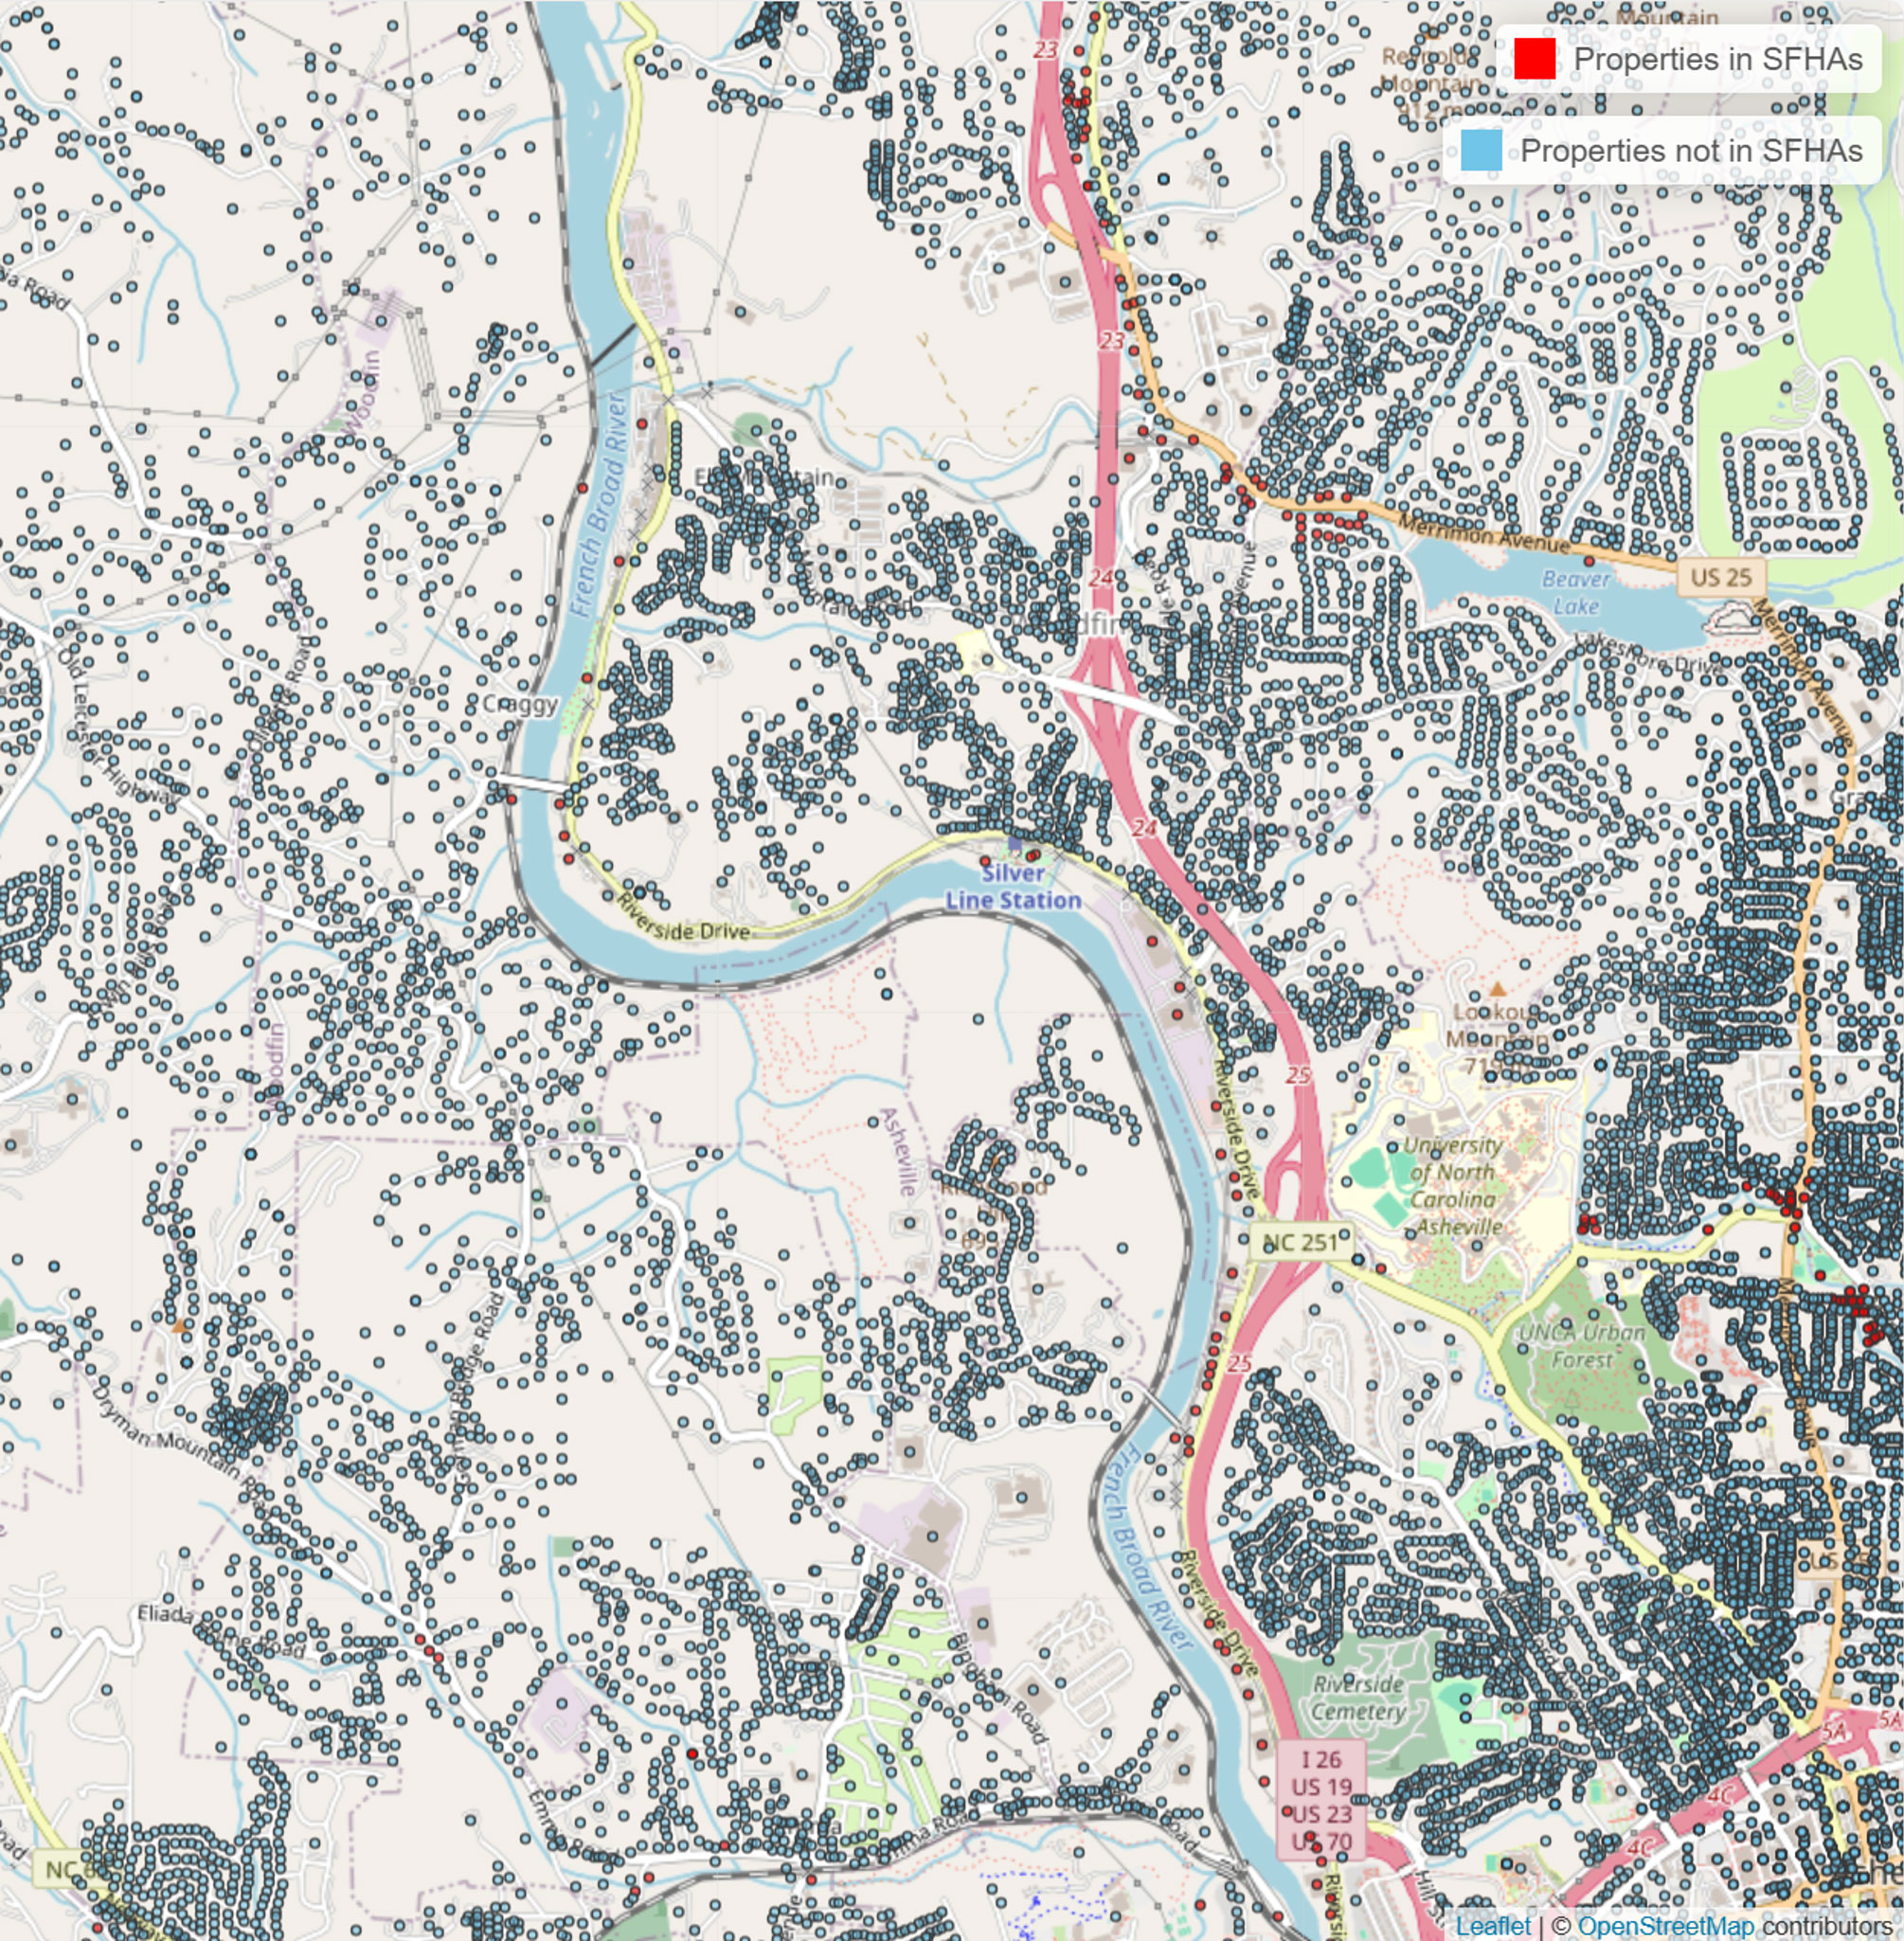
Figure 9. Properties in the greater Asheville area. Source: ICE Climate, ICE Property Assessment Tables, and FEMA as of 4/22/2025.
This pattern holds true across the country. Between June 1 and December 31, 2024, over eight million properties across the United States were located in the areas of observed flood alerts from the National Weather Service. In total, approximately 7% of these properties would be required to have flood insurance by mortgage providers because they are situated in SFHAs.
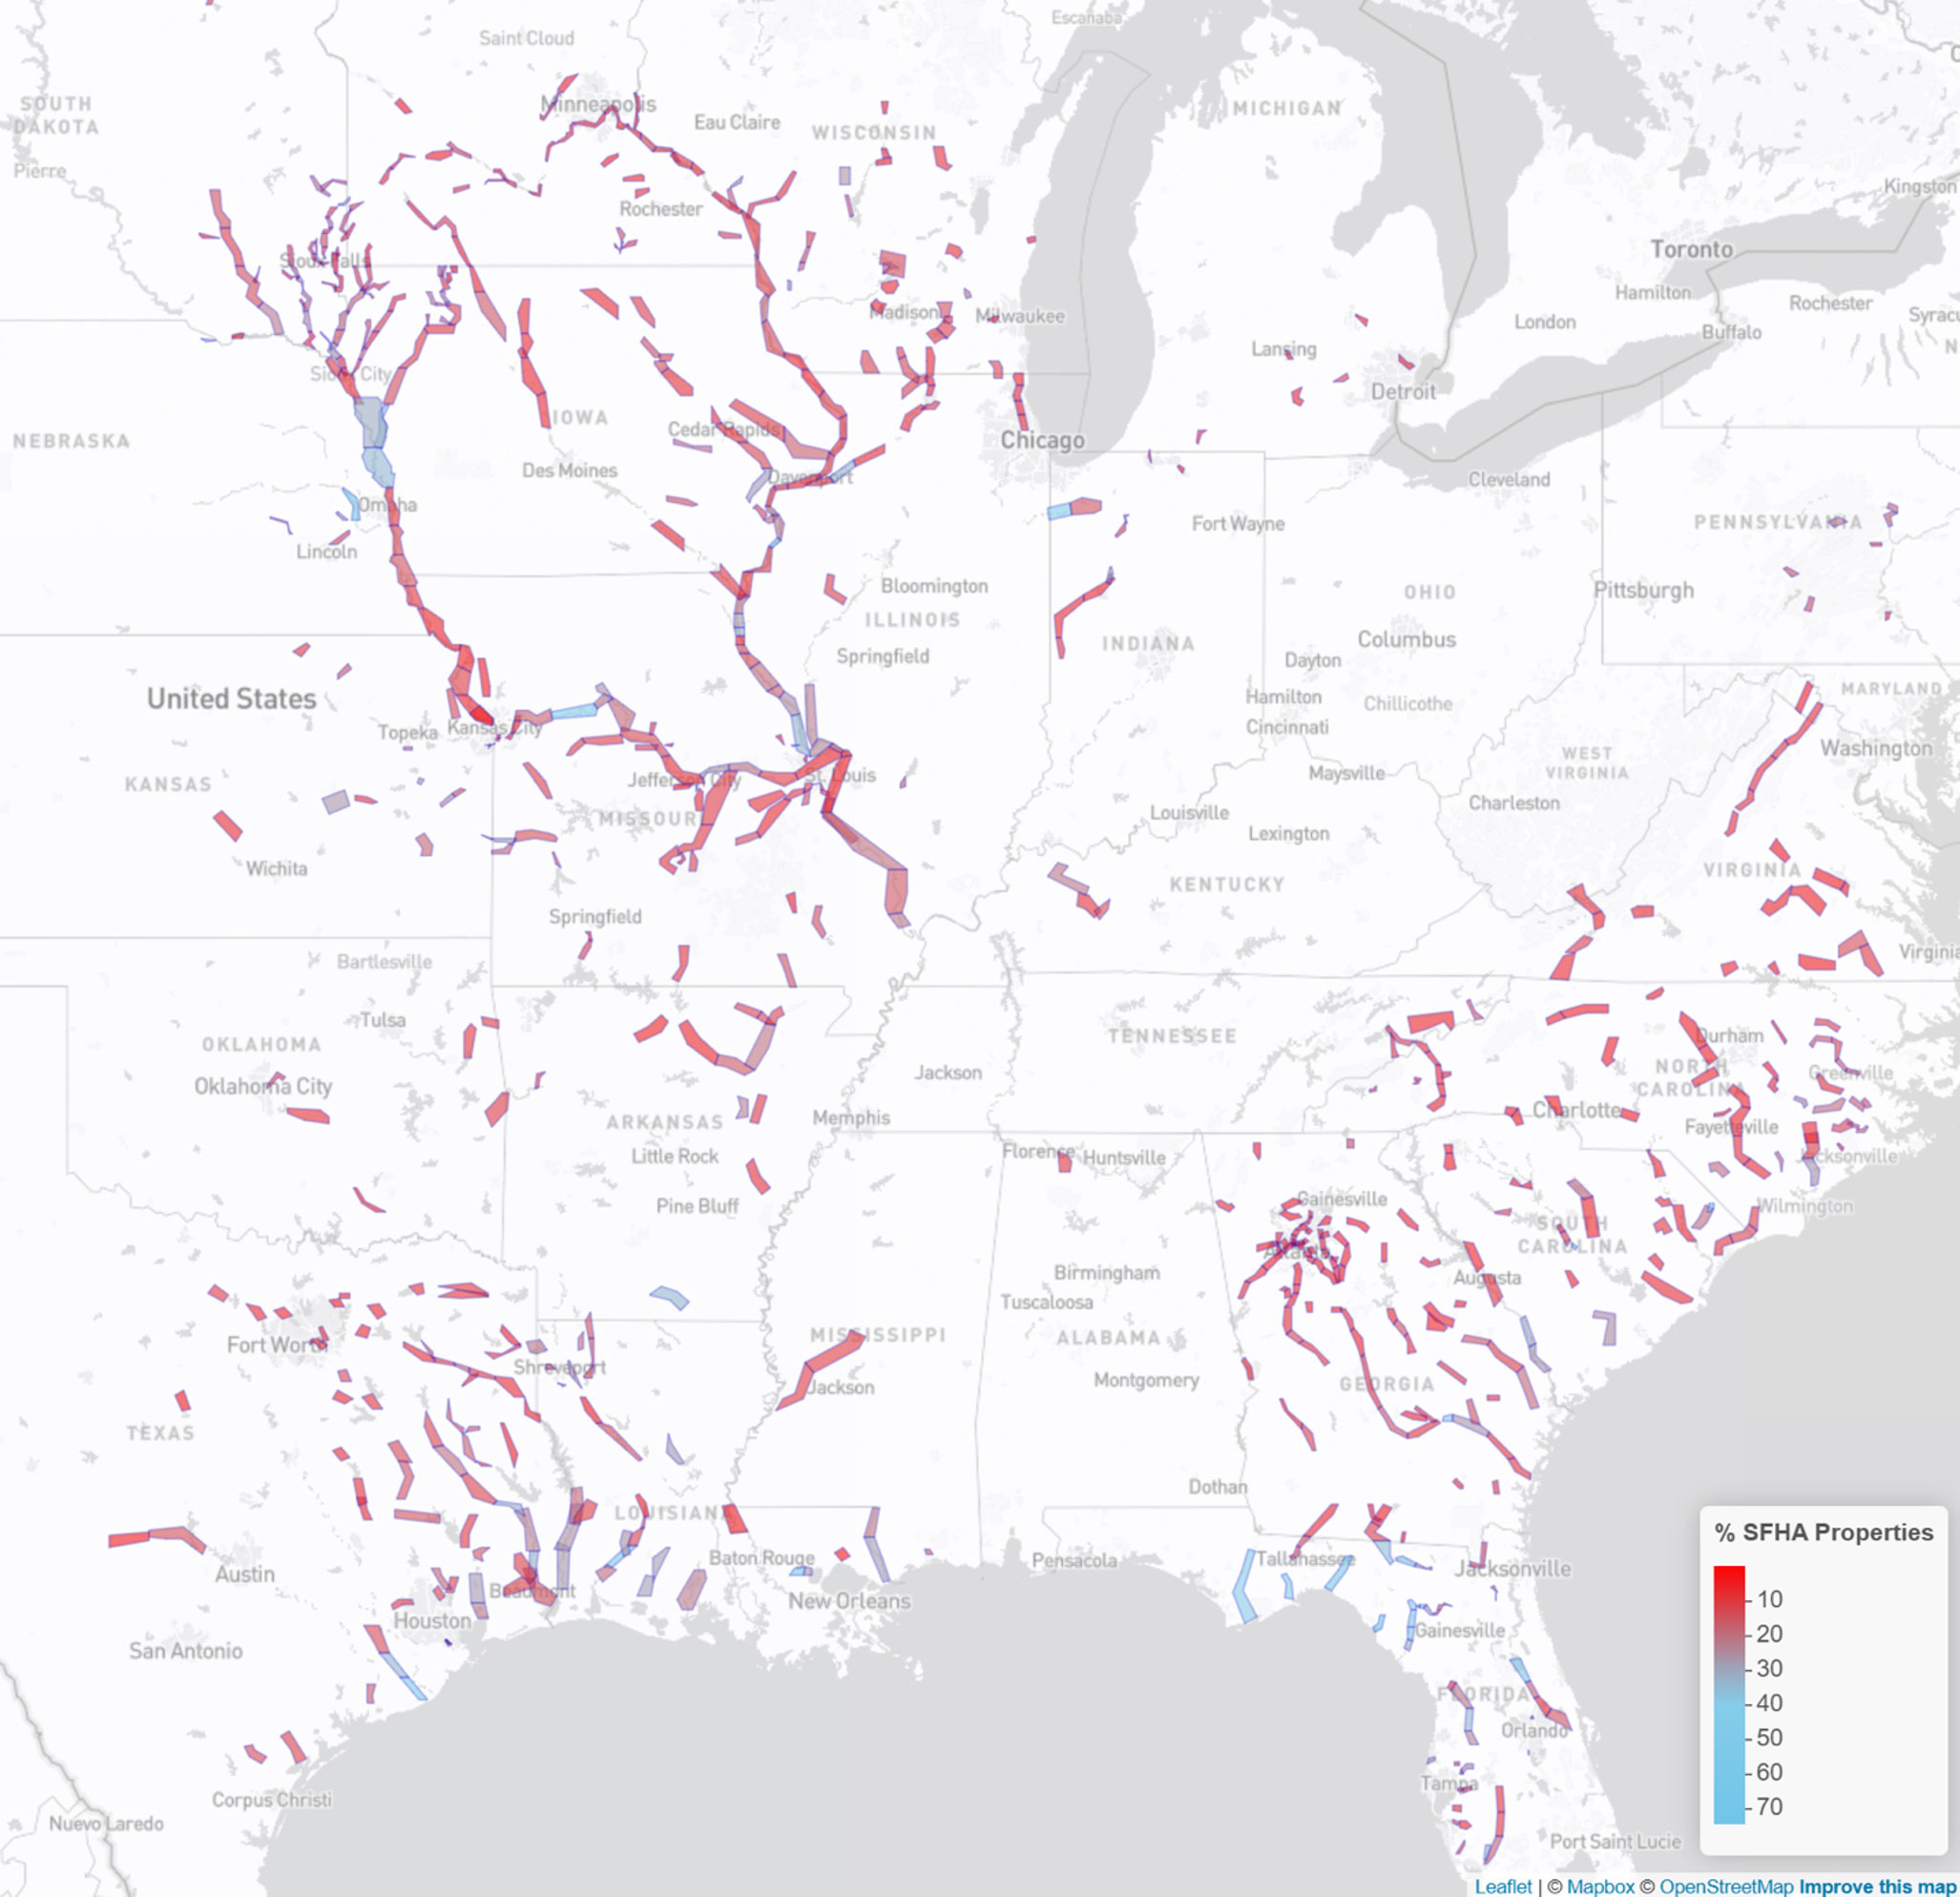
Figure 10. Observed flood alerts issued by the National Weather Service between June 1 and December 31, 2024, shaded by the percentage of properties in FEMA flood zones (SFHAs) as of April 2025. Source: ICE Climate as of 4/22/2025.
Commercial mortgage-backed security exposure
In the case of the 2024 hurricane season, ICE Climate can identify about 11,000 property locations in active commercial mortgage-backed security (CMBS) deals that were exposed to high windspeeds. These properties were in over 2,700 deals associated with over 36,000 securities.
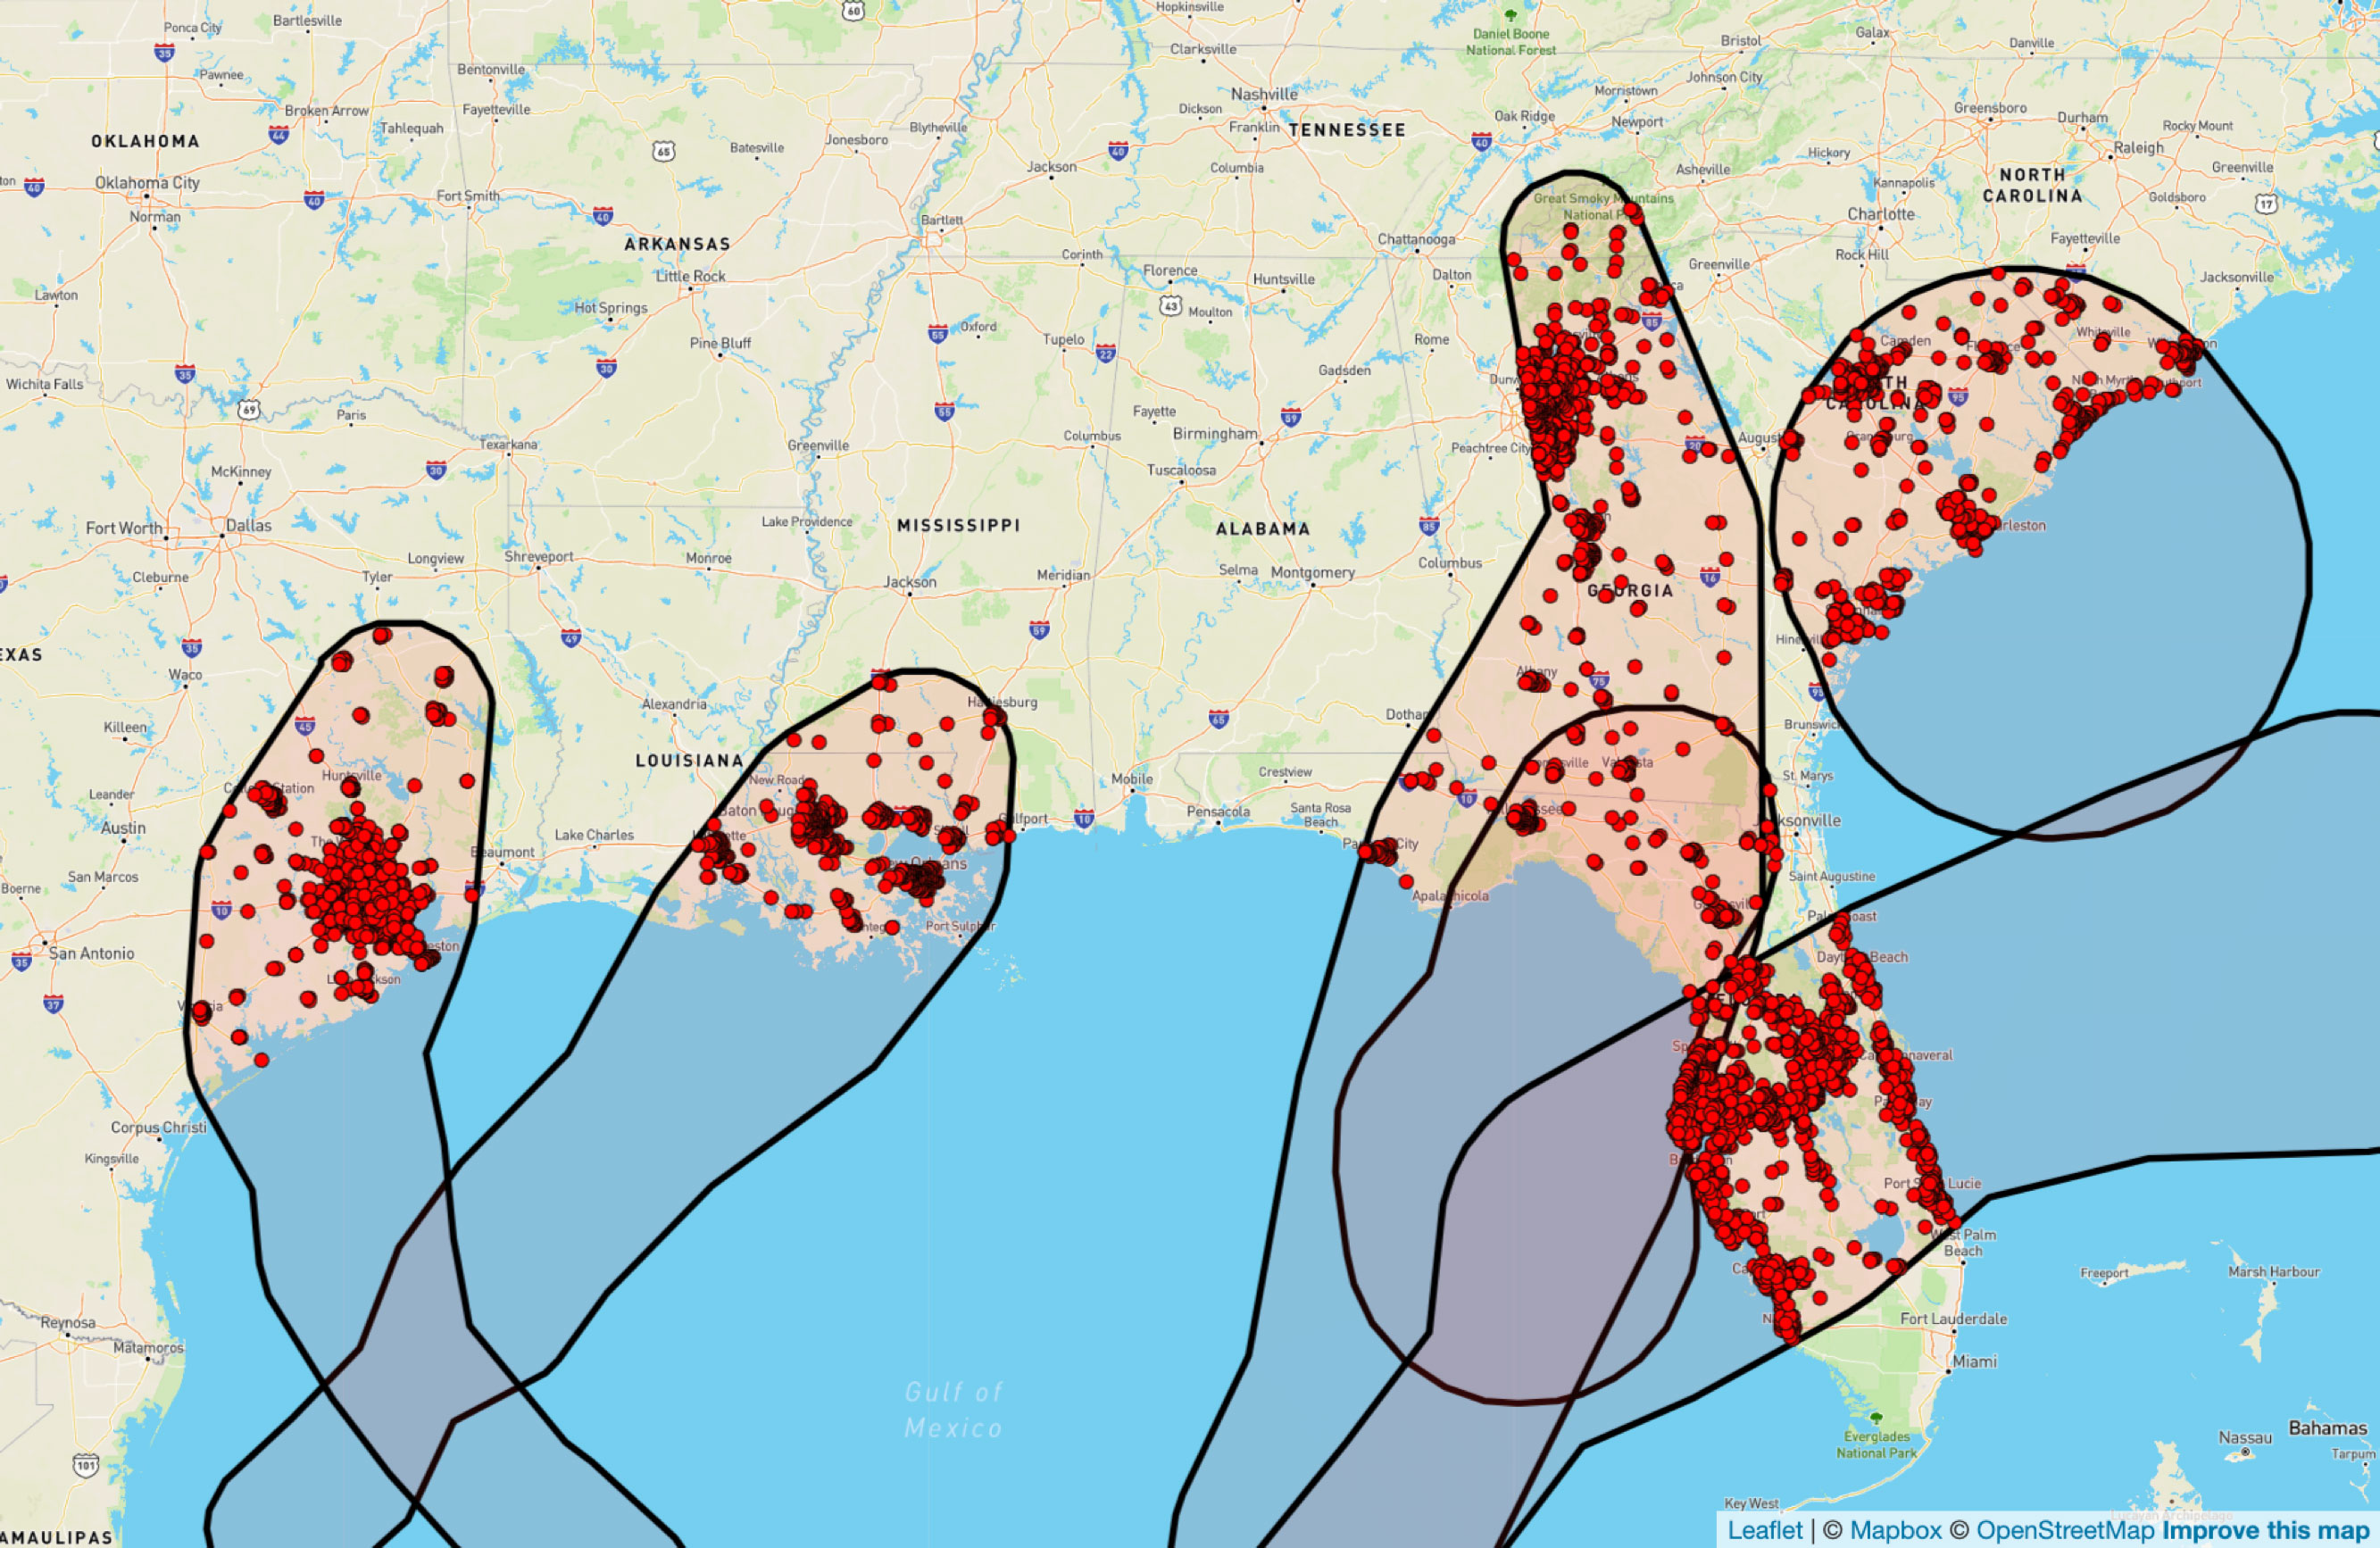
Figure 11. Exposed properties in live CMBS deals as of April 2025. Source: ICE Climate as of 04/25/2025.
| No. exposed locations¹⁹ | No. exposed deals²⁰ | No. live securities | |
|---|---|---|---|
| Beryl | ~3,100 | ~1,900 | ~26,290 |
| Francine | ~800 | ~850 | ~14,000 |
| Debby | ~1,780 | ~1,470 | ~20,940 |
| Helene | ~2,770 | ~1,480 | ~21,410 |
| Milton | ~4,000 | ~1,870 | ~26,540 |
Table 5. Summary of CMBS exposure to large U.S. hurricanes of 2024. Source: ICE Climate as of 04/25/2025.
For CMBS investors interested in digging deeper, exposed locations can be further identified by their property type — including offices, industry and retail locations among many others.
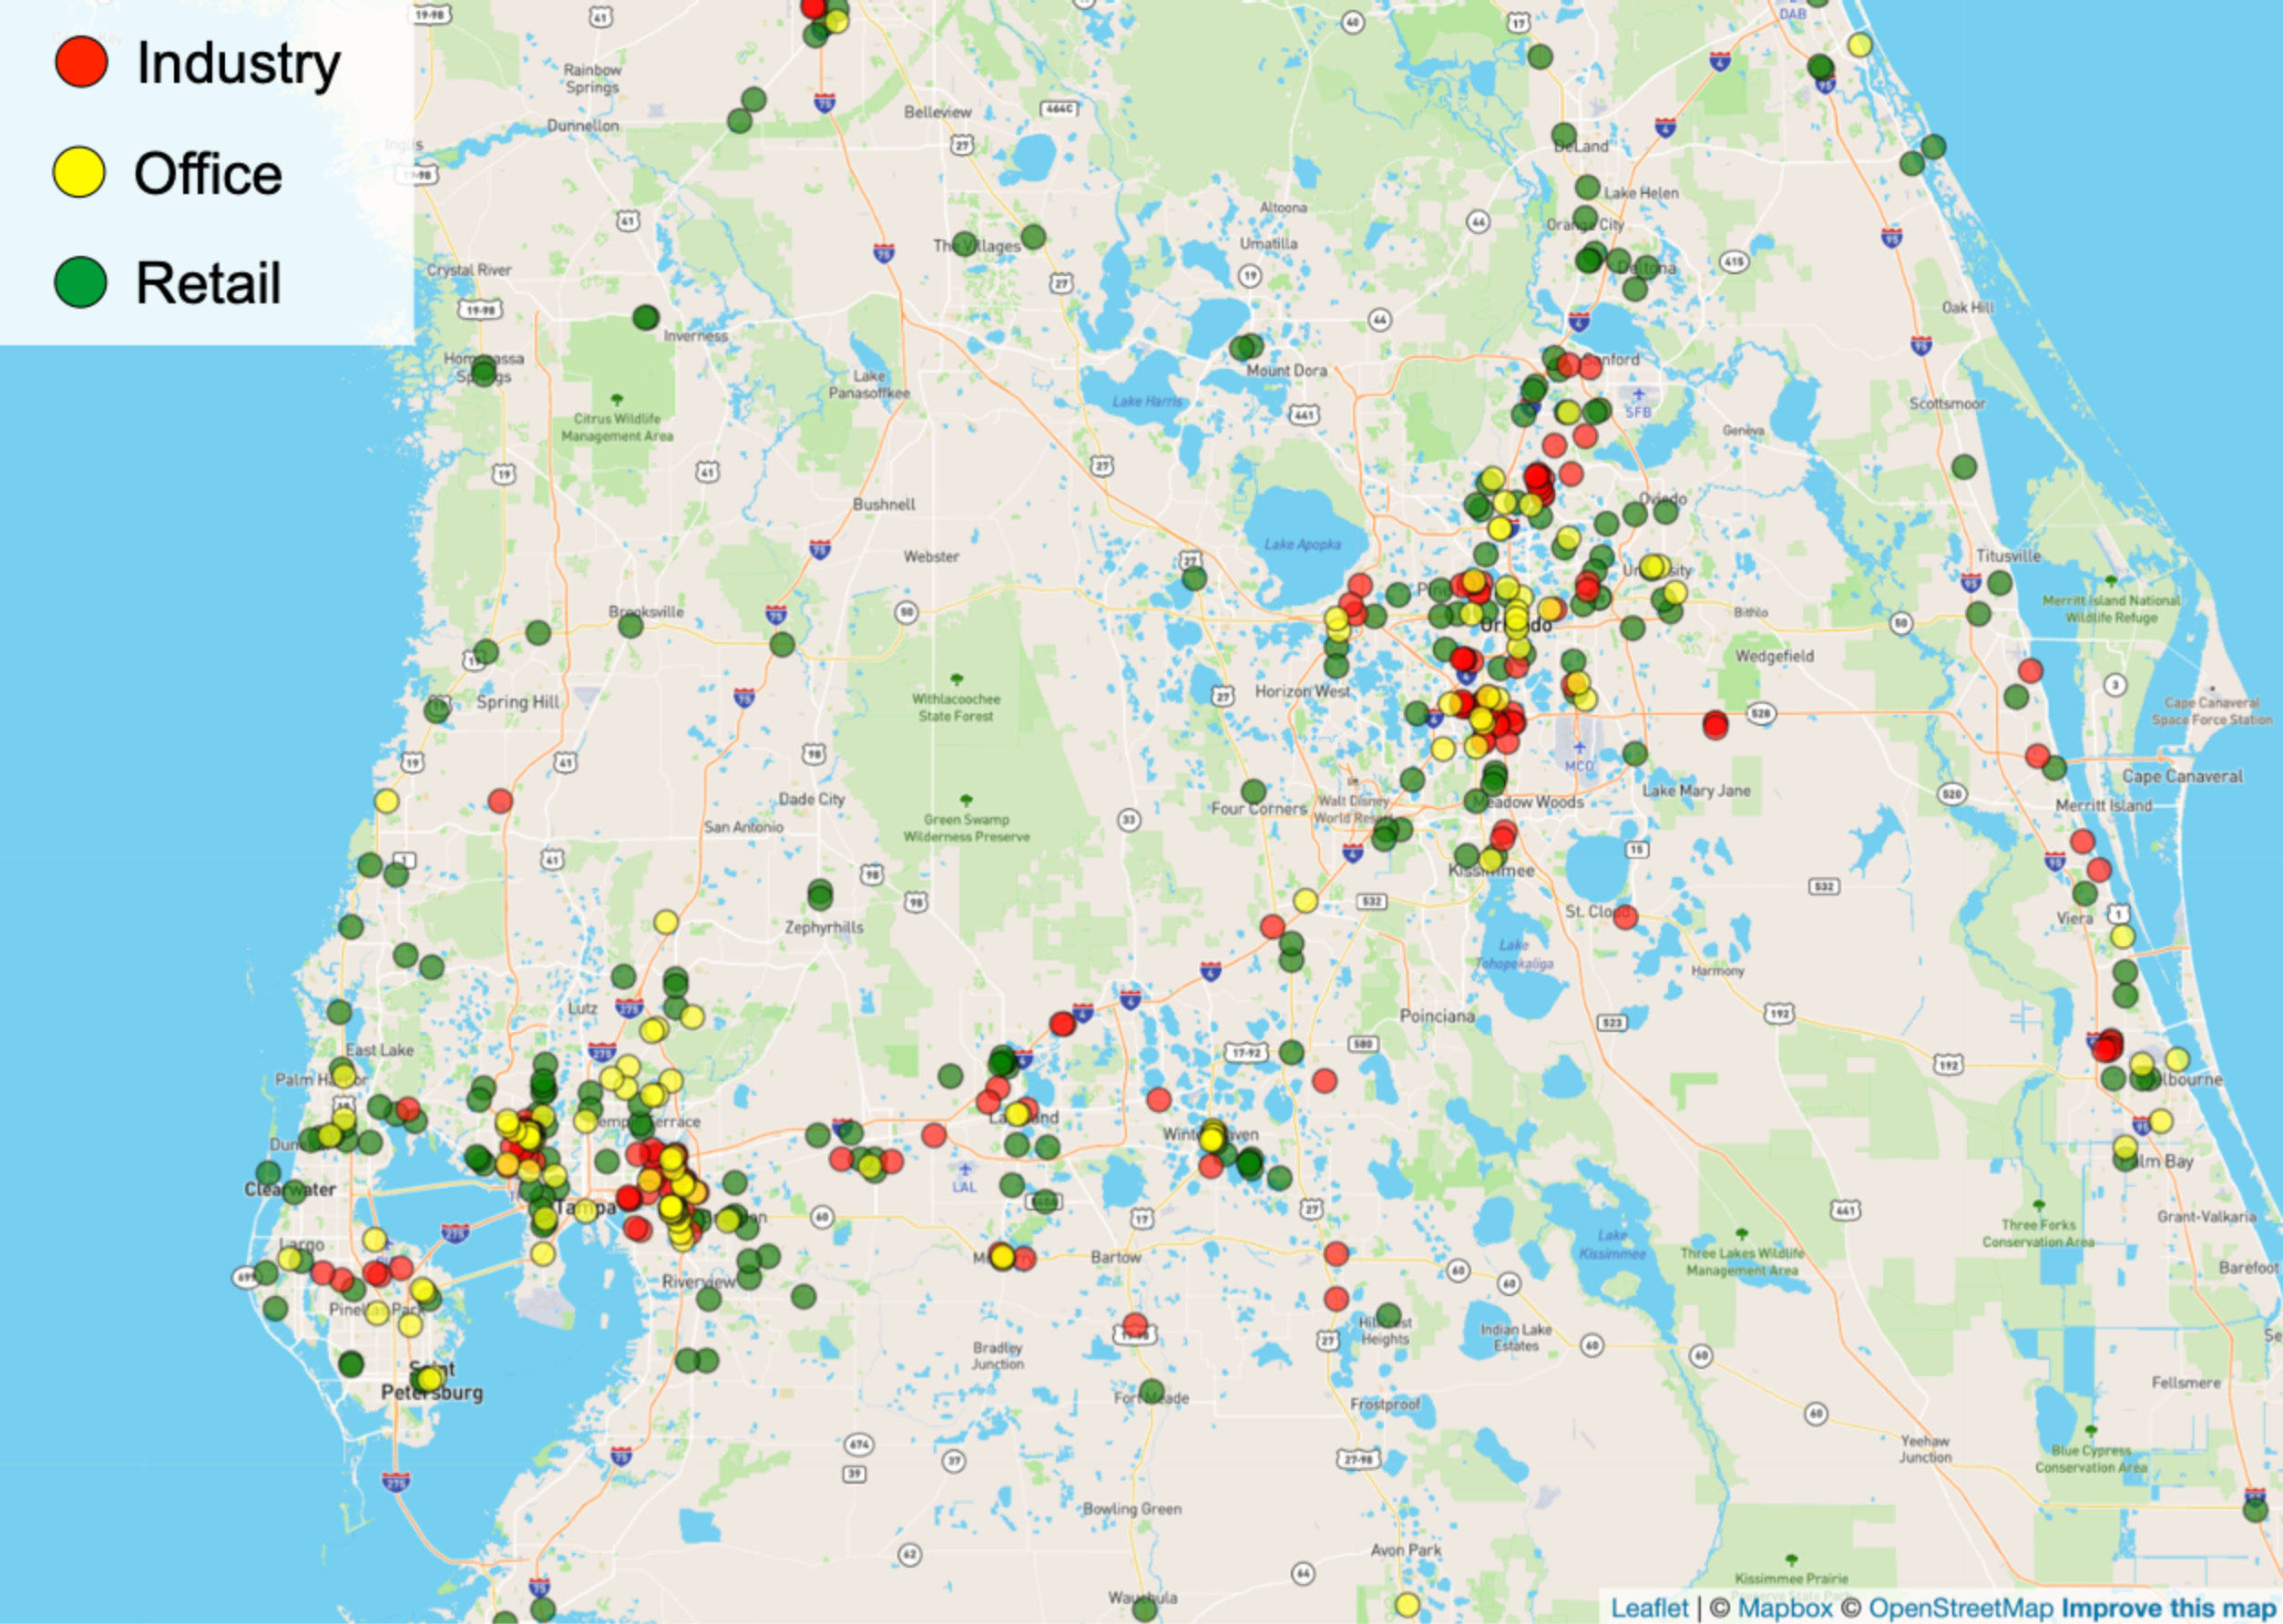
Figure 12. Exposed retail, office, and industry locations in live CMBS deals exposed to storm-force winds during Hurricane Milton. Source: ICE Climate as of 04/25/2025.
Looking to 2025
The goal of ICE Climate is to provide data that makes markets more resilient and risks more transparent. As the 2025 hurricane season begins, this exposure information can illuminate imminent financial risks that may not have been previously appreciated. For corporate market stakeholders, these risks are likely to be material — material and actionable.
Contact us to learn more about ICE Climate and our physical and transition risk modelling capabilities.
1 Smith, AB (Jan 10 2025). 2024: An active year of US billion-dollar weather and climate disasters. Available at: https://www.climate.gov/news-features/blogs/beyond-data/2024-active-year-us-billion-dollar-weather-and-climate-disasters
2 Pulver, D (30 Nov 2024). Hurricane season ends Saturday. It was one of the deadliest in recent memory. USA Today. Available at: https://www.usatoday.com/story/news/nation/2024/11/30/2024-atlantic-hurricane-season-ends-with-at-least-335-us-deaths/76619181007
3 Allam, C. (3 Dec 2024). Areas hardest hit by Helene flooding in NC are the least likely to have flood insurance. Raleigh News & Observer. Available at: https://www.newsobserver.com/news/state/north-carolina/article293479469.html
4 Green, B & A Tringali (27 March 2025). Hurricane Helene’s Impact on Housing in Western North Carolina. Federal Reserve Bank of Richmond. Available at: https://www.richmondfed.org/
5 Thomae, L. (21 Nov 2024). NC municipal water systems score wins after Helene. But work far from over. Carolina Public Press. Available at: https://carolinapublicpress.org/67249/nc-municipal-water-systems-score-wins-after-helene-but-work-far-from-over/
6 Newborn, S. (16 Oct 2024). Tens of millions of gallons of wastewater flowed into Tampa Bay waterways during Hurricane Milton. WUSF (NPR). Available at: https://www.wusf.org/environment/2024-10-16/tens-of-millions-of-gallons-of-wastewater-flowed-into-tampa-bay-waterways-during-hurricane-milton
7 Stern, L. (9 Nov 2024). Assessing the Environmental Consequences of Hurricanes Helene and Milton in Florida. Florida Specifier. Available at: https://floridaspecifier.com/issues/v46n6/assessing-the-environmental-consequences-of-hurricanes-helene-and-milton-in-florida/
8 Kemin Food Technology Blog (18 Oct 2024). Impacts of Hurricane Helene and Milton Felt Across the Poultry Industry. Kemin. Available at: https://www.kemin.com/na/en-us/blog/food/hurricane-impact-on-poultry
9 Turner, J (10 Dec 2024). Hurricane Milton dealt a huge blow to Florida's citrus industry. WUSF (NPR). Available at: https://www.wusf.org/economy-business/2024-12-10/hurricane-milton-dealt-a-huge-blow-to-floridas-citrus-industry
10 Landi, H. (7 Oct 2024). US Hospitals prep for supply chain constraints in wake of Baxter International plant closure. Fierce Healthcare. Available at: https://www.fiercehealthcare.com/providers/us-hospitals-prep-supply-chain-constraints-wake-baxter-international-plant-closure
11 Gordon, B. (3 Dec 2024). Helene shuts down Spruce Pine, NC mine that is pivotal to world’s semiconductor industry. The News & Observer. Available at: https://www.newsobserver.com/news/business/article293265924.html
12 Storm force winds are defined here at 50 knots or higher. ICE Climate also integrates windspeed paths for lower and higher windspeeds (higher than 34 knots and 64 knots respectively).
13 Maze, J. (11 Oct 2024). Hurricane Helene hammered restaurant sales. Restaurant Business Online. Available at: https://www.restaurantbusinessonline.com/financing/hurricane-helene-hammered-restaurant-sales
14 Restaurants and bars are defined here as locations with a Standard Industry Classification (SIC4) code of 58 (“Eating and Drinking Places”) in ICE Climate’s corporate asset location data set.
15 For simplicity here, number of securities are only for live corporate bonds as of 04/25/2025 issued in U.S. dollars with ISINs. Numbers go up significantly if securities issued in other currencies (and securities without ISINs in ICE reference data) are included.
17 Ifatusin, V.A. Barely 1% of Buncombe structures carried flood insurance, data show. Asheville Watchdog. Available at: https://avlwatchdog.org/barely-1-of-buncombe-structures-carried-flood-insurance-data-show/
18 Allam, C. (3 Dec 2024). Areas hardest hit by Helene flooding in NC are the least likely to have flood insurance. Raleigh News & Observer. Available at: https://www.newsobserver.com/news/state/north-carolina/article293479469.html
19 ‘Locations’ here is defined as unique addresses associated with live deals, including latitude, longitude, number and street if available, state, city, and property type designation.
20 Active deals and securities as of 04/25/2025.
Related resources
- Read moreMunicipal bond exposure to Hurricanes Helene and Milton
A new hazard monitoring tool allows municipal bond market participants to better understand their exposure to extreme weather events.
- Read morePhysical climate hazards: A growing risk for financial markets
ICE Climate’s new physical risk datasets provide a global, portfolio-wide view of risk exposure across corporate and sovereign asset classes.
- Read moreHow 1.6 billion buildings power ICE’s global climate risk analytics
ICE Climate’s exposure datasets enable climate risk assessments at the building footprint level globally.
- See moreExplore our solutions
Quantifying climate risk and opportunities in fixed income and real estate.