How municipal bond insurers underwrite for decades of extreme weather risk
A conversation with Jamie Shilling, Deputy Chief Credit Officer at BAM Mutual, on long-term natural hazard risk.
May 11, 2026
BAM Mutual is a municipal bond insurance company that has guaranteed more than $175 billion of municipal bonds financing essential public infrastructure for more than 6,500 communities in all 50 states. Deputy Chief Credit Officer Jamie Shilling recently met with Larry Lawrence, Head of ICE Climate, to discuss BAM’s approach to analyzing and managing natural hazard risk.
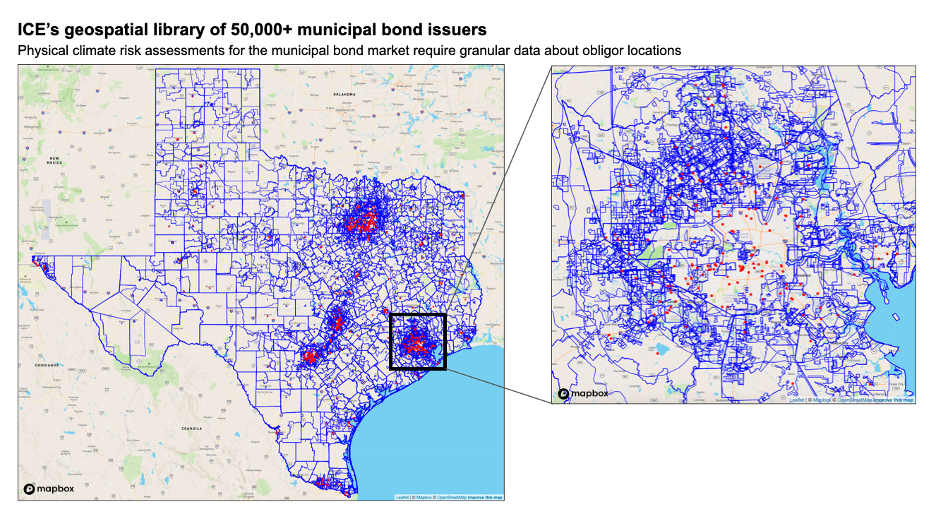
Figure 1: ICE’s Municipal Bond Geospatial Library — a library of locations associated with 50,000+ municipal bond issuers — is the foundation of the ICE Climate Analytics Platform. Municipal bond locations for issuers in Texas are shown above, including school district boundaries, utility service areas, hospital, university, and charter school systems, and many others. Source: ICE Climate as of April 2026.
Larry Lawrence, ICE: ICE Climate estimates that approximately $298 billion in outstanding municipal debt is associated with issuers exposed to significant wildfire, flood, or hurricane risks1 — about 7% of the market. Based on these numbers alone, it’s clear to us that climate risk should matter to municipal bond investors, but can you talk me through why it’s important for BAM Mutual to understand natural hazard risk when you are considering insuring a new bond issue?
Jamie Shilling, BAM Mutual: Municipal bonds have relatively low default rates compared with other fixed income investments, but that doesn’t mean credit analysis in the sector is simple. States, local governments, school districts, and other municipal bond issuers are exposed to a wide range of risks: some specific to the issuer, like responsible fiscal management, and some that apply at a macro level, like the potential for economic disruptions and access to financial support from other levels of government.
Natural hazard risk is a key consideration for municipal bond investors because it cuts across all of those categories: investors need to understand the potential for an extreme weather event or other natural hazard to strike a community, the level of damage it could inflict on the economy - and specifically the revenues pledged to pay debt service on its bonds - and the bond issuer’s capacity to respond and rebuild if necessary.
BAM insurance protects investors by guaranteeing timely payments of interest and principal for the life of every bond we insure – typically up to 25 or 30 years. Our insurance can’t be cancelled before the bonds mature, and our obligation to pay is unconditional. You can think of us as the ultimate long-term commitment: a marriage with no possibility of divorce.
BAM’s underwriting process has always considered an issuer’s exposure to natural hazards with a particular emphasis on earthquake, flood, hurricane, and wildfire. We want to understand whether those events have the potential to impact the community and its economy in ways that could interfere with tax revenues and ultimately bond payments, and we look at potential long-term and short-term disruptions. We want to understand the level of damage a single storm or earthquake could inflict, as well as the potential for multiple events to strike a community over that multi-decade period.
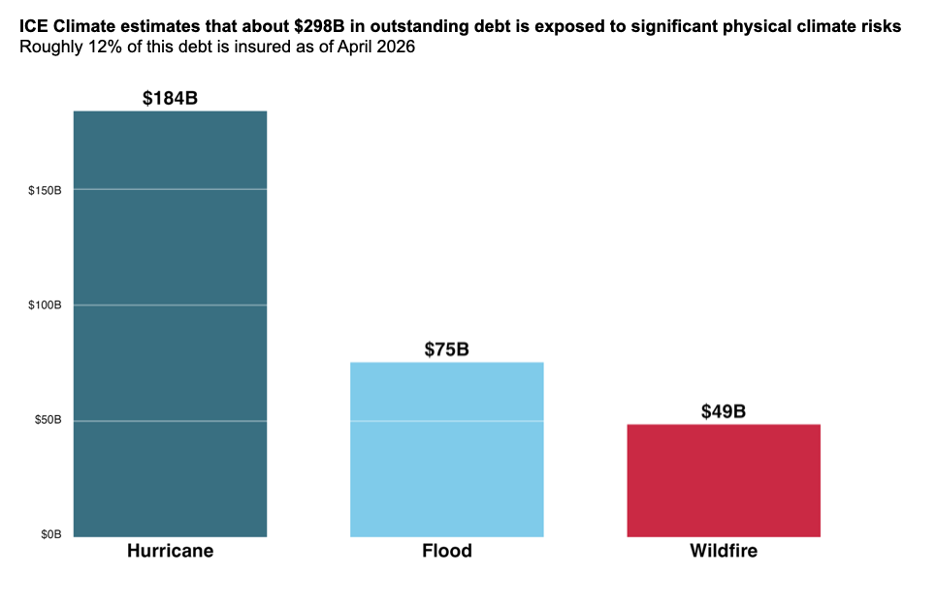
Figure 2: ICE Climate estimates of total outstanding debt exposed to significant physical climate risk (identified here as securities with an ICE Risk Score ≥ 3 in 2025 under a Shared Socioeconomic Pathway 5-8.5 climate scenario) by peril across the municipal bond market as of April 2026. Source: ICE Climate.
Larry: How can natural hazard risk translate to losses for municipal bond investors or insurers?
Jamie: We think about everything that can disrupt an issuer’s economy and its cash flows. That might mean long-term damage to property – including residences, commercial or industrial buildings, or government facilities – that could disrupt economic activity and tax collections or impose large, unforeseen rebuilding costs. But we’re also watching for very short-term impacts, like damage to communications infrastructure that could physically prevent local officials from making on-time payments to investors, even if they have the cash in their accounts.
It’s important to remember that many municipal bond investors rely on the semi-annual cash flow from their holdings to make their own essential payments, like rent or the grocery bill, and so we take our obligation to make timely payments very seriously: we make sure the investor gets their cash on schedule, and then work with the issuer to cure any defaults.
Larry: On a practical level, how does BAM evaluate natural hazard risk?
Jamie: We use a variety of tools to assess natural hazard risk, including the ICE Climate Analytics Platform, FEMA’s National Risk Index, and other risk-specific tools primarily for earthquake. Every credit we underwrite gets prescreened for natural hazard risk through ICE Climate Analytics. Based upon the platform’s output, we may decide to continue our credit review, consult with other natural hazard risk assessment resources, or suspend our credit review (reject the credit) if the natural hazard risk exceeds our risk acceptance parameters.
If the ICE Climate Analytics Platform flags an issuer for elevated natural hazard risk, we consider the probability of such an event occurring and the projected loss or impact of such an event on both the repayment source and overall credit. There are more than 50,000 individual borrowers in the municipal bond market and nearly as many discrete credit pledges, so you really have to understand both the hazard risk, and how it interacts with the legal structure and security pledge of a specific bond issue.
For example, sales tax receipts often increase following a natural hazard as residents replace lost items and rebuilding activity begins, while lower property values associated with a natural hazard can have a negative impact on property tax receipts, special assessments, and tax increment revenues. In an abatement lease, an issuer is not required to make annual lease payments if it does not have use and occupancy of the encumbered asset – often a specific property, like a school building.
In addition to probability and loss magnitude, we also look at the possibility that an issuer could be found to have a legal liability associated with the natural hazard – this is particularly relevant in California with respect to wildfires.
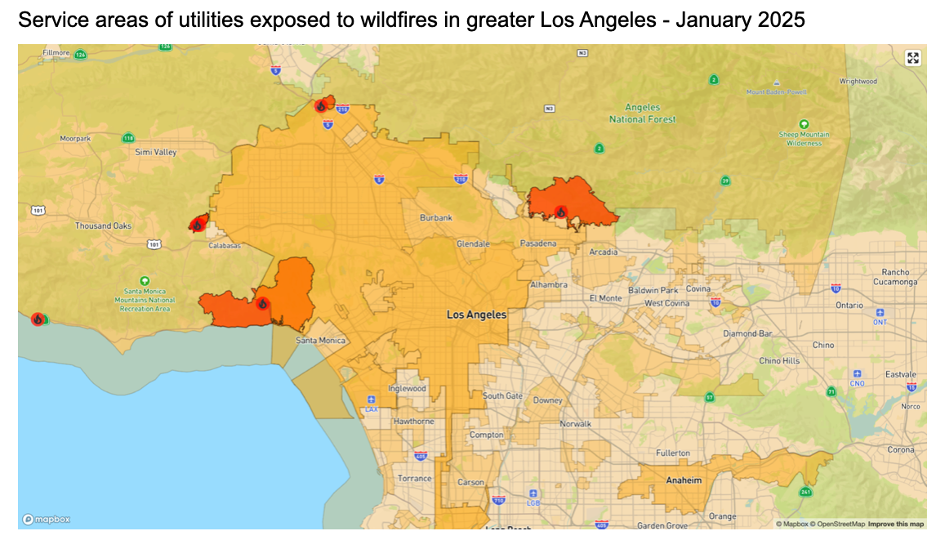
Figure 3: ICE Climate’s Hazard Watch tool identifying the service areas of utilities (yellow) exposed to the wildfires (red) in greater Los Angeles in January 2025. Source: ICE Climate Analytics Platform.
Longer-term impacts on the overall credit itself can include the availability and cost of commercial property and casualty insurance, who ultimately pays for the recovery efforts and future prevention efforts, and impacts to economic vitality and property value.
Larry: What factors can help a credit overcome its exposure to natural hazard risk?
Jamie: We take a granular look at conditions on the ground in the community. Mitigants to elevated natural hazard risk can include average age of construction, geographical footprint of the issuer, more stringent and peril-driven building codes, a state intercept program, substantial investment in mitigation efforts, and zoning restrictions.
Larry: Does BAM take any other steps to manage the overall hazard risk in your portfolio?
Jamie: Absolutely. Once the overall natural hazard risk is fully assessed at the issuer level, BAM may either approve the credit as-is or approve the credit but limit our exposure to the credit and/or region. Reduced exposure limits associated with elevated natural hazard risk are highly correlated to the ICE Climate Analytics Platform’s projected loss values.
Want to learn more about ICE Climate Analytics?
Jamie Shilling’s comments do not constitute individual investment recommendations or advice. Investors considering the merits of a particular debt issue should read the Official Statement prepared for it. If BAM insurance has been purchased for some but not all of the bonds being offered for sale, the Official Statement will identify which bonds are insured. For more information, please view Terms of Use: http://buildamerica.com/terms-of-use.
The statements and representations of Jamie Shilling and/or BAM (collectively “BAM”), including but not limited to any descriptions of ICE Group's products, services, methodologies, data, or roadmap, are solely those of BAM and do not constitute statements of ICE Group. ICE Group has not independently verified, and expressly disclaims any responsibility or liability for any such statements or representations made by BAM. Recipients should not rely on any statements made by BAM as reflecting the views, commitments, or representations of ICE Group.
Related resources
- Learn moreICE Climate Analytics for Municipal Debt
Climate risk has the potential to upend the municipal market.
- Learn moreICE Climate
Quantifying climate risk and opportunities in fixed income and real estate.