

The U.S. Dollar Index ® (USDX) ended August at 97.78, with a decline of 2.02%. In early August, the index reached a high of 100.05 but steadily retraced as the month progressed, reflecting a shift in sentiment following softer labor market data, mixed inflation readings, and signs of slowing economic momentum.
- Nonfarm Payrolls for July increased by just 73,000, well below market expectations of 110,000, although up from the prior month’s (revised) 14,000, highlighting the challenging jobs market over the past few months. Despite this, the unemployment rate held steady, while average hourly earnings grew by 0.3% monthly and 3.9% annually, suggesting that wage inflation remained resilient even as job growth slowed. The USDX closed at 98.48, with a loss of 1.33% on the day.
- Annual Core Inflation, excluding food and energy, edged up to 3.1% for the 12 months ending in July, from 2.9% in June. Headline Consumer Price Index (CPI) for the same period remained steady at 2.7%, just short of expectations. The USDX closed at 97.90 with a loss of 0.46%.
- The Federal Reserve released minutes from the July meeting, which showed that officials chose to hold interest rates steady, citing economic uncertainty and a split between those worried more about stubborn inflation exacerbated by tariffs and those concerned about job market weakness. The USDX closed marginally lower on the day at 98.16, down 0.04%.
Market commentary
DX
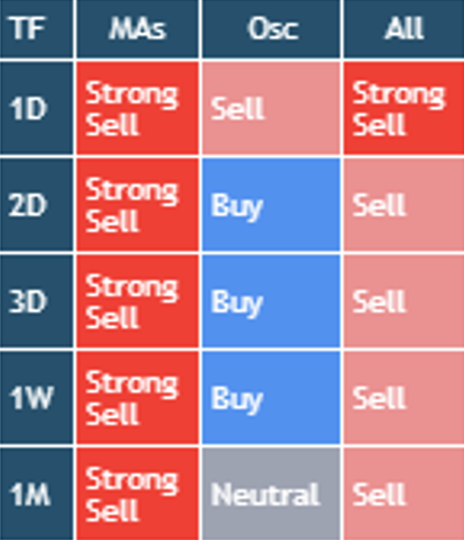
Conditions
High impact events per day
- 11 Consumer Price Index
- 12 Michigan Consumer Sentiment Index PREL
- 16 Retail Sales
- 17 Fed Interest Rate Statement and Monetary Policy Statement
- 23 S&P Global Manufacturing PMI (PREL) and S&P Global Services PMI (PREL)
- 25 Gross Domestic Product (GDP) Annualized Q2
- 26 Core Personal Consumption Expenditures - Price Index
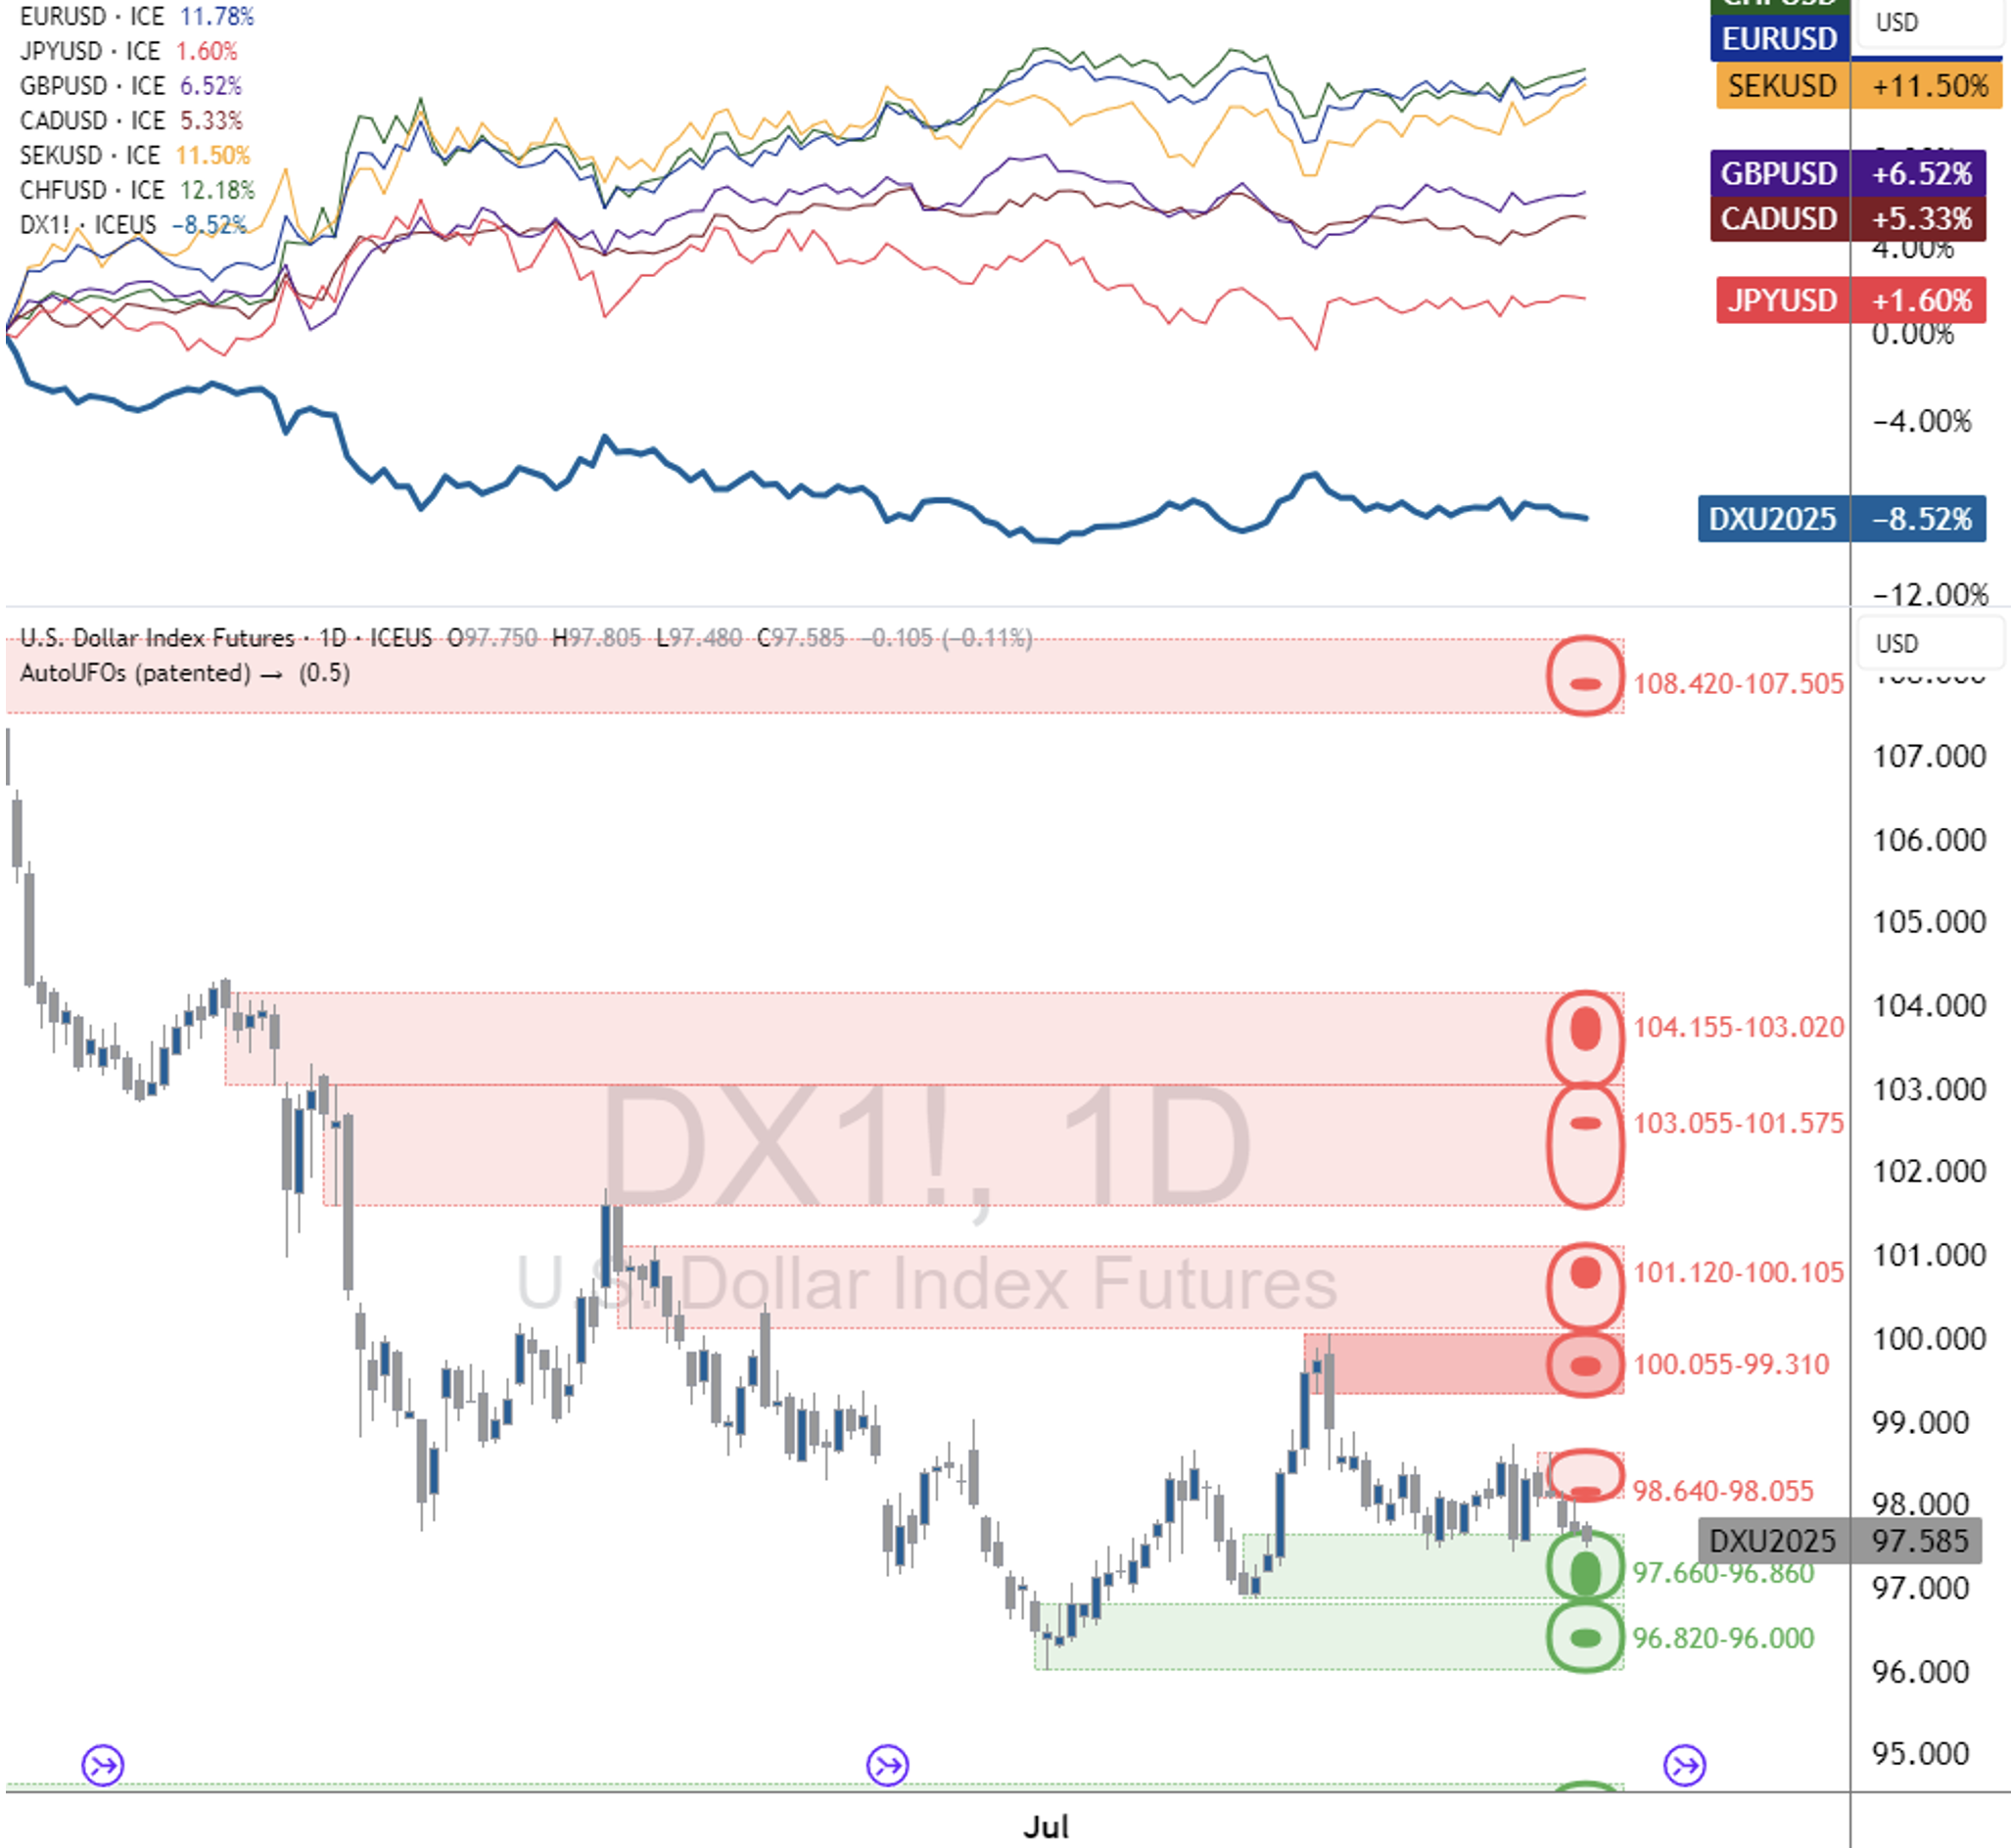
Weighting: EUR 57.6% / JPY 13.6% / GBP 11.9% / CAD 9.1% / SEK 4.2% & CHF 3.6% | Source: TradingView | Conditions Table: using daily SMA (10, 20, 30,50, 100, 200), EMA (10, 20, 30,50, 100, 200), Ichimoku Cloud (9, 26, 52), VWMA (20), HullMA (9), RSI (14), Stochastic (14, 3, 3), CCI (20), ADX (14, 14), Awesome Oscillator, Momentum (10), MACD (12, 26, 9), Stochastic RSI (3, 3, 14, 14), Williams %R (14), Bulls and Bears Power and Ultimate Oscillator (7,14,28) | Support & Resistance Levels: using AutoUFOs® (0.5) applied to a daily timeframe (plotted as dotted lines that represent relevant support and resistance price zones colored as follows: red = resistance levels & green = support levels)
The U.S. Dollar Index ® (USDX) opened the month at 99.81 but quickly retreated after encountering resistance between 99.81 - 100.05 on the 4-hour chart, which sat just below a daily resistance area at 100.10 - 101.12. Market sentiment was also weighed down by weaker-than-expected July Nonfarm Payrolls, which rose by 73,000 new jobs versus a consensus of 110,000, and a contraction in the ISM Manufacturing PMI to 48, announced the same day. While average hourly earnings rose by 0.3% monthly and 3.9% annually, supporting underlying wage growth, the continued contraction in the manufacturing sector dampened demand for the U.S. Dollar. The U.S. Dollar Index ® closed at 98.48 on August 1st, with a loss of 1.33%, marking the worst daily performance of the month. Following a strong end to July, recorded earlier in the week, the week ended with a gain of 1.13%.
The following week, the USDX traded sideways during the initial few days, closing with modest gains of 0.02% and 0.10% on August 4th and 5th, despite the July ISM Services PMI coming in weaker than expected at 50.1, which was below expectations and indicated contraction from the prior month. The index then declined on August 6th, dropping 0.52% to 98.02, as demand for the U.S. Dollar weakened. The bearish sentiment persisted into the following trading day and the USDX closed slightly lower, at 97.93, down 0.09%. However, on August 8th, market sentiment shifted, and the USDX rebounded. Although it met some resistance at the midpoint of the daily Bollinger Bands, the index closed 0.28% higher. Despite this late reversal, the U.S. Dollar Index ® closed the week down 0.42% at 98.09.
On August 11th, the bullish sentiment continued, and the USDX rallied above the midpoint of the daily Bollinger Bands to test a newly formed daily resistance area between 98.38 - 98.89. After reaching a high of 98.50, the USDX pulled back slightly as the bears returned, although the index ultimately closed with a gain of 0.27% at 98.35. However, the following day, demand for the U.S. Dollar weakened following the release of Annual Core Inflation data, which rose to 3.1% year-on-year for July, up from 2.9% in June. Headline CPI remained steady at 2.7%, just below expectations. Reflecting this, the USDX closed down 0.46% at 97.90. The bearish sentiment continued into August 13th, and the index traded lower, closing with a loss of 0.24%, dipping into a daily support area between 97.66 - 97.18. After finding support, the sentiment reversed on August 14th, and the demand for the U.S. Dollar strengthened. This upward momentum was extended further after the Producer Price Index jumped to 3.7% in July from 2.6% in June, surprising the markets. The USDX rebounded to close at 98.06, with a gain of 0.49%. On the final trading day of the week, after testing the 30-day EMA, the USDX encountered resistance and closed with a loss of 0.35%, despite Retail Sales data figures meeting expectations. The U.S. Dollar Index ® closed the week at 97.71, with a loss of 0.39%, locked between an area of support below (97.66 - 97.18) and the midpoint of the Bollinger Bands with a resistance area (98.38 - 98.89) just above.
The following week, the USDX retested the daily support area, which held, and the USDX traded higher for two consecutive days. The index met resistance at the midpoint of the daily Bollinger Bands on August 20th and pulled back slightly after the release of the FOMC minutes. The minutes revealed officials chose to hold interest rates steady at 4.25% - 4.50%, citing economic uncertainty and a split in policymakers' concerns between those worried more about stubborn inflation exacerbated by tariffs and those concerned about job market weakness. The USDX closed marginally lower on the day at 98.16, with a 0.04% loss. The USDX recovered the following day as demand for the U.S. Dollar returned, and the index closed higher with a gain of 0.43% at 98.54, trading back inside the daily resistance area. Sentiment reversed on August 22nd and the USDX dropped rapidly from this area, the bearish momentum driven by the Federal Reserve Chair Jerome Powell's speech at the Jackson Hole Symposium after Powell signaled the possibility of upcoming rate cuts. This dovish tone, combined with concerns over economic growth and inflation, spurred a sharp sell-off in the USDX as traders priced in looser monetary policy ahead. However, Powell also maintained that the Fed would remain data-dependent and committed to its inflation goals, signaling caution. The USDX closed down 0.91% at 97.61. Despite the significant weakness on the last trading day of the week, the U.S. Dollar Index ® closed the week with a modest loss of 0.08% back into the daily support area.
The Jackson Hole Symposium continued over the weekend with additional developments issued following the August 22nd announcement. On August 25th, market focus shifted to Powell’s firm commitment to controlling inflation and the Fed’s readiness to adjust policy if needed, reinforcing the view that rate cuts were not guaranteed and that tightening could continue. This boosted demand for the U.S. Dollar, and the USDX rallied from the support area to close at 98.35 with a gain of 0.79%, marking the strongest daily performance of the month. The next day, the USDX reached a high of 98.46, driven by demand and retested the daily resistance area at 98.38 - 98.89 before retreating to close lower at 98.14, with a loss of 0.25%. On August 27th the demand for the U.S. Dollar initially strengthened and the USDX rallied to reach a high of 98.64 before closing down 0.09% at 98.09. On August 28th, despite preliminary Q2 Gross Domestic Product (GDP) annualized data exceeding expectations, showing an annualized growth rate of 3.3%, an increase on previous expectations, the USDX closed lower, down 0.28% at 97.78. The month ended on August 29th, with continued U.S. Dollar weakness, closing down 0.20% on the final trading day, despite this the USDX closed the week with a 0.21% gain. The U.S. Dollar Index ® closed the month at 97.78, down 2.02%. The U.S. Dollar Index ® remained in a downtrend on the weekly chart and transitioned to sideways on the daily timeframe, locked between the daily support and resistance areas and threading through the 20 and 30 EMAs.
USDX® performance
| Spot Rates | Ticker | 1-Aug-25 | 29-Aug-25 | Monthly Change |
|---|---|---|---|---|
| USD/EUR | EUR A0-FX | 1.1583 | 1.16826 | 0.853% |
| JPY/USD | JPY A0-FX | 147.375 | 146.993 | 0.260% |
| USD/GBP | GBP A0-FX | 1.3278 | 1.3503 | 1.666% |
| CAD/USD | CAD A0-FX | 1.3785 | 1.3735 | 0.364% |
| SEK/USD | SEK A0-FX | 9.6302 | 9.4554 | 1.849% |
| CHF/USD | CHF A0-FX | 0.8038 | 0.80005 | 0.469% |
| US Dollar Index | DX A0 | 99.141 | 97.771 | -1.401% |
| Front Month | Ticker | 1-Aug-25 | 29-Aug-25 | Monthly Change |
|---|---|---|---|---|
| Mini USDX | SDX-ICS | 98.93 | 97.69 | -1.269% |
| Other Contracts | Ticker | 1-Aug-25 | 29-Aug-25 | Monthly Change |
|---|---|---|---|---|
| Brent Crude | BM-ICS | 69.67 | 68.12 | -2.275% |
| MSCI World Index | MWL | 4039.3 | 4183.8 | 3.454% |
| MSCI Emerging Markets Index | MME | 1228.1 | 1264.9 | 2.909% |
| Mini US Dollar/Offshore Renminbi | CHM-ICS | 7.2127 | 7.1201 | 1.301% |
Source: ICE Connect
Restrictions on distribution
The distribution of this document and the offering of any products, investments or strategies mentioned in it may be restricted by law in certain jurisdictions. None of ICE Futures Singapore, Intercontinental Exchange Inc. nor any of their affiliates (collectively, “ICE”) represent that this document may be lawfully distributed, or that any product, investment or strategy described in it may be lawfully offered in compliance with any applicable laws or requirements in any such jurisdiction.
Disclosure section
This document does not provide individually tailored financial or investment advice, and no part of this document should be construed as doing so. This document has been prepared without regard to the individual financial or other circumstances and objectives of persons who receive it. Investors and users should independently evaluate particular products, investments, and strategies and are encouraged to seek the advice of a financial advisor. The appropriateness of a particular product, investment or strategy will depend on a user or investor's individual circumstances and objectives. The products, investments or strategies discussed in this document may not be suitable for all users and investors, and certain users or investors may not be eligible to purchase or participate in some or all of them.
ICE Futures Singapore does not provide financial, investment, legal or tax advice and is not in the business of doing so. Each user or investor should always consult a financial, investment, legal or tax advisor for information concerning its individual situation and to learn about any potential financial, investment, legal, tax or other implications that may result from any product, investment or strategy described in this document.
In particular, any opinion contained in this document (including an indication of any “sell”, “neutral” or “buy” condition) is generic and not a recommendation to take (or omit to take) any action in relation to any product, investment or strategy.
Key Information Documents for certain products covered by the EU Packaged Retail and Insurance-based Investment Products Regulation can be accessed on the relevant exchange website under the heading “Key information Documents (KIDS)”.
© 2025 Intercontinental Exchange, Inc. The information and materials contained in this document - including text, graphics, links or other items - are provided for general information only on an "as is" and "as available" basis. Although this document is issued in good faith, no representation, warranty or guarantee, whether express or implied, is or will be made in respect of the information contained herein. ICE excludes all liability arising from or in relation to the accuracy, adequacy, completeness, fitness or timeliness of the information provided and assumes no duty whatsoever. The information in this document is liable to change, and ICE undertakes no duty to update such information. You should not rely on any information contained in this document without first checking that it is correct and up to date. No information set out or referred to in this document shall form the basis of any contract. The content of this document is proprietary to ICE in every respect and is protected by copyright. No part of this material may be copied, photocopied or duplicated in any form by any means or redistributed without the prior written consent of ICE. All third-party trademarks are owned by their respective owners and are used with permission.
Trademarks of ICE and/or its affiliates include Intercontinental Exchange, ICE, ICE block design, NYSE, and New York Stock Exchange. Information regarding additional trademarks and intellectual property rights of Intercontinental Exchange, Inc. and/or its affiliates is located at www.ice.com/privacy-security-center