

ICE Compass: buy-side trading analytics for targeted sell-side conversations
Even in today’s digital age, information asymmetry continues to characterize the dynamic between buyers and sellers. Nowhere is this truer than in fixed income markets. On one side are dealers and market-makers, ingesting millions of pieces of incoming market intelligence around bond prices, order flow and client volume every second.
On the other are buy-side firms that rely on indications of interest and requests for quote (RFQs) to get a sense of where assets are currently trading. It is here that the information asymmetry takes on a tangible cost: once the buy-side issues an RFQ for a bond or a basket of bonds, the act of requesting a quote influences the price that responding dealers send back to them.
Quantifying the financial cost of indicating trading intent is difficult, but in a market where the U.S. alone sees $1.8 trillion in fixed income assets traded each day,1 even a drag of a single basis point equates to $180 million in aggregate cost to fixed income investors daily — or more than $45 billion annualized.
The core of the problem is information leakage surrounding the buy-side's pre-trade intent. If communication between bond dealers and the buy-side were more precisely targeted, it would yield significant benefits for both parties: tighter bids and offers for the buy-side, and higher client win rates and order flow for bond dealer desks. This is precisely what our new ICE Compass platform helps to provide.
ICE Compass is an AI-powered trading analytics platform that gives fixed income trading desks prioritized sell-side counterparty rankings and price estimates before executing trades.
Here’s how it works: the platform combines a bond market participant’s own real-time and historical trading data with ICE’s market data and pricing streams, as well as the millions of bids and offers, indications of interest and other pricing data points that the entity receives from trading counterparties each day.
ICE Compass enriches this raw data by applying our proprietary data assets, such as ICE Continuous Evaluated Pricing™, fixed income liquidity metrics and indices. The ICE Compass model tracks intraday market movements, trading costs and trading behaviors to generate estimates that help support counterparty selection and pre-trade cost analysis.
By applying AI and predictive analytics, the platform estimates counterparty price commitment prior to indicating trading intent. Practically speaking, this means that if a buy-side firm is typically serviced by 10 bond dealer counterparties, ICE Compass will rank each of them on the competitiveness of their bids and offers by fixed income asset class, by maturity, and other parameters.
Equipped with these pre-trade insights, the buy-side can go directly to the counterparty estimated to be most aggressive on price and execute with them, minimizing information leakage and lessening the possibility of bond prices moving against them.
ICE Compass also delivers benefits for the sell-side: bond dealer desks that are most competitive on price will be rewarded with greater client volume and order flow as the platform will recognize and recommend them to buy-side participants.
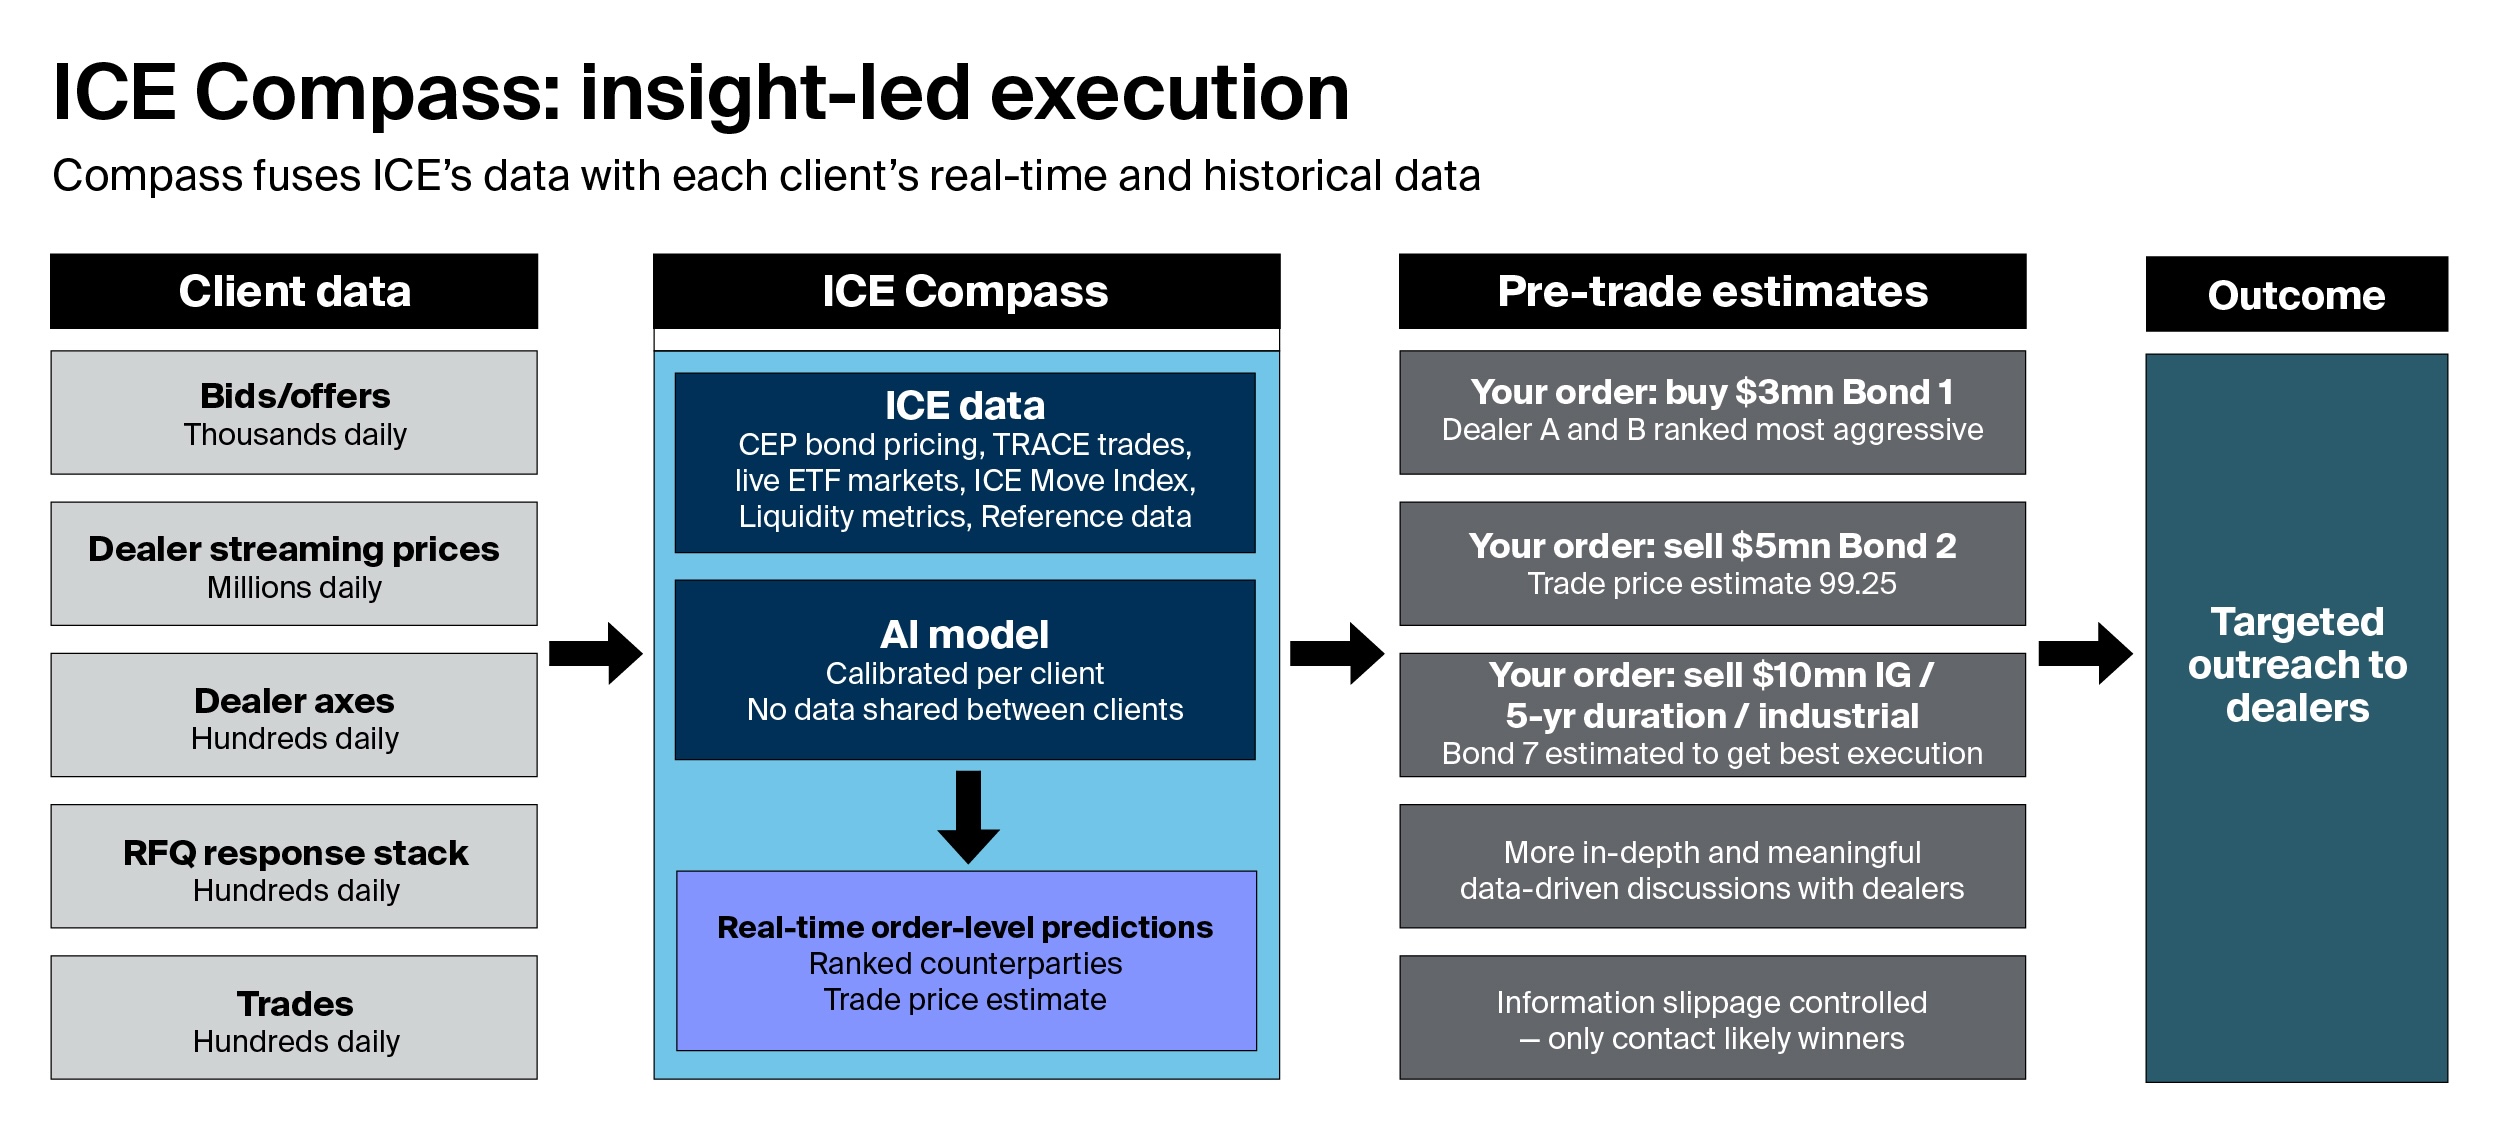
Figure 1. ICE Compass workflow. Source: ICE
Rather than disrupting the existing relationships between the sell-side and their buy-side clients, ICE Compass is designed to make their communication more meaningful. The platform will help sift out non-competitive prices from daily workflows and allow more aggressive market makers to rise to the top. ICE Compass also has the potential to break the existing practice of buy-side firms using backward-looking post-trade transaction cost analysis (TCA) data as a means of identifying competitive dealer counterparties based on their price aggressiveness in the recent past.
Even better, the ICE Compass data model improves over time and is continuously enhanced as new trading data is incorporated, progressively refining the platform’s counterparty rankings and pricing estimates.
T. Rowe Price has already signed onto the platform as an anchor client, with their participation just the latest step in the asset manager’s “continued evolution toward a more transparent, data-driven, and scalable trading model.”
Over the coming months we’ll be adding more participants on both the buy-side and sell-side to ICE Compass and demonstrating to the wider fixed income community the value of a platform that enables users to gain new pre-trade insight and estimate costs before they go to the market.
1. SIFMA, Research Quarterly: Fixed Income – Issuance and Trading, April 15, 2026
ICE Fraud Monitor: Mortgage Fraud Detection
As mortgage fraud becomes more sophisticated, lenders face increasing pressure to validate data early and move applications efficiently. Chris McEntee, VP, Product and Corporate Development at ICE, shares how data, workflow integration and speed are helping address these challenges.
U.S. Treasury Clearing: How to prepare for the transformation
In this webinar, fixed income leaders from ICE, BNY and Citi discuss the latest developments in U.S. Treasury clearing ahead of the December 31, 2026, deadline for centrally clearing cash securities.
Protecting public digital assets with ICE Digital Trust
State and local government’s choice of custody partner for taxpayer-owned digital assets is critical to meet the public fiduciary responsibility to voters. ICE Digital Trust is a digital asset custody offering tailored to reduce the risk of theft and is designed with best-in-class technology, processes and governance to support custody of public-sector-owned digital assets.
Home Equity Withdrawals Reach Highest First-Quarter Level Since 2021
The June ICE Mortgage Monitor reveals that first-quarter second-lien withdrawals hit an 18-year high in 2026 as borrowers sought to preserve lower interest rates during the first three months of the year.
Newsletter archive
Disclosure
Trading and execution services are offered through ICE Bonds Securities Corporation or ICE Bonds, member FINRA, MSRB and SIPC. The information found herein, has been prepared solely for informational purposes and should not be considered investment advice, is neither an offer to sell nor a solicitation of an offer to buy any financial product(s), is intended for institutional customers only and is not intended for retail customer use.
This material contains information that is confidential and the proprietary property and/or a trade secret of Intercontinental Exchange, Inc. and/or its affiliates (the “ICE Group”), is not to be published, reproduced, copied, modified, disclosed or used in any way without the express written consent of the ICE Group. This document is provided for informational purposes only. The information contained herein is subject to change and does not constitute any form of warranty, representation, or undertaking. Nothing herein should in any way be deemed to alter the legal rights and obligations contained in agreements between the ICE Group and its respective clients relating to any of the products or services described herein. Nothing herein is intended to constitute legal, tax, accounting, or other professional advice.
The information contained herein is provided “as is” and the ICE Group makes no warranties whatsoever, either express or implied, as to merchantability, fitness for a particular purpose, or any other matter. The ICE Group makes no representation or warranty that any data or information (including but not limited to evaluated pricing) supplied to or by it are complete or free from errors, omissions, or defects. Without limiting the foregoing, in no event shall the ICE Group have any liability for any direct, indirect, incidental, exemplary, compensatory, punitive, special or consequential damages, costs, expenses, legal fees, or losses (including, without limitation, lost income or lost profits) in connection with any use of and/or reliance on the content of this document even if advised of the possibility of such damages.
This document is not an offer of advisory services and is not meant to be a solicitation, or recommendation to buy, sell or hold securities. This document represents ICE Group’s observations of general market movements. Trades and/or quotes for individual securities may or may not move in the same direction or to the same degree as indicated in this document. Please note that the information may have become outdated since its publication.
Trading analytics available from ICE Data Pricing & Reference Data are a point in time output and as such dependent on and take into account the information available to ICE Data Pricing & Reference Data at the time of calculation. ICE Data Pricing & Reference Data does not have access to all relevant trade-related data or dealer quotes, and the utility of the output may diminish depending upon amount of available data underlying the analysis. The inputs utilized in each of the trading analytics services described herein depend on the methodologies employed by each such service and may not be the same as the inputs used in the other trading analytics services. There are many methodologies (including computer-based analytical modelling) available to calculate and determine information such as Trading Analytics described herein. ICE Data Pricing & Reference Data’s trading analytics may not generate results that correlate to actual outcomes, and/or actual behavior of the market, such as with regard to the purchase and sale of instruments. There may be errors or defects in ICE Data Pricing & Reference Data’s software, databases, or methodologies that may cause resultant data to be inappropriate for use for certain purposes or use cases, and/or within certain applications. Certain historical data may be subject to periodic updates over time due to recalibration processes, including, without limitation enhancement of ICE Data Pricing & Reference Data’s models and increased coverage of instruments. Although ICE Data Pricing & Reference Data may elect to update the data it uses from time to time, it has no obligation to do so.
Fixed income evaluations, continuous evaluated pricing, end-of-day evaluations, evaluated curves, model-based curves, market sentiment scores, and Fair Value Information Services related to securities are provided in the US through ICE Data Pricing & Reference Data, LLC and internationally through ICE Data Services entities in Europe and Asia Pacific. ICE Data Pricing & Reference Data, LLC is a registered investment adviser with the US Securities and Exchange Commission. Additional information about ICE Data Pricing & Reference Data, LLC is available on the SEC’s website at www.adviserinfo.sec.gov. A copy of ICE Data Pricing & Reference Data, LLC’s Form ADV is available upon request.
Trademarks of the ICE Group include: Intercontinental Exchange, ICE, ICE block design, NYSE, ICE Data Services, ICE Data, and New York Stock Exchange,. Information regarding additional trademarks and intellectual property rights of the ICE Group is located at www.ice.com/privacy-security-center. Other products, services, or company names mentioned herein are the property of, and may be the service mark or trademark of, their respective owners.
Fixed Income
Manage risk, uncover opportunities, and make informed decisions in real-time with ICE’s end-to-end fixed income solutions. Reimagine your fixed income workflow from price transparency & discovery and efficient execution through to performance analysis.